
If you’ve ever traded divergence before but was never profitable…
Then chances are that you’re trading it the wrong way.
Because if you trade it the right way…
Not only can trading divergence give you high probability trades…
But it can also be one of the most profitable trading strategies you ever trade.
In this ultimate guide, I’m going to cover everything you need to know about trading divergence.
You’re going to learn how to get high probability divergence signals with the Stochastic Oscillator…
I’m also going to share with you the two different types of divergence…
Then I’m going to give you my divergence trade setups so that you can trade divergence like a pro.
This is going to be a pretty long and in-depth guide.
So I strongly encourage you to set aside at least the next 15 – 30 minutes or so to go through this entire guide in detail.
With that said, let’s begin.
What is Stochastic Divergence?
Stochastic Divergence is simply a divergence between the market and the Stochastic Oscillator.
This happens when the wave patterns of the market and the Stochastic Oscillator differ.
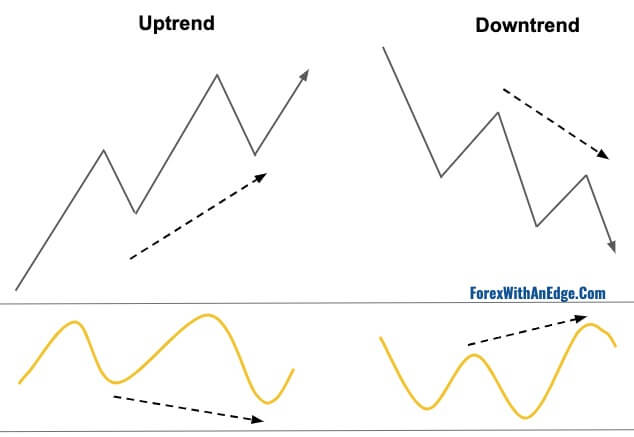
In an uptrend, the market will form wave patterns of higher highs and higher lows:

In a downtrend, the market will for waver patterns of lower lows and lower highs:

These “highs” are also called peaks, and these lows are also called “troughs”.
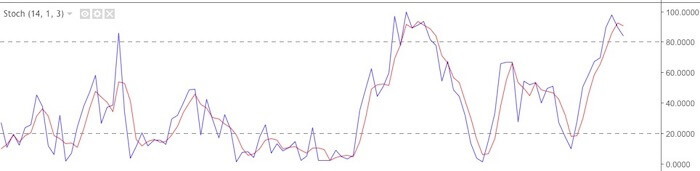
When the market is making these wave patterns, the Stochastic Oscillator is also making wave patterns that mimic the market’s peak and troughs.
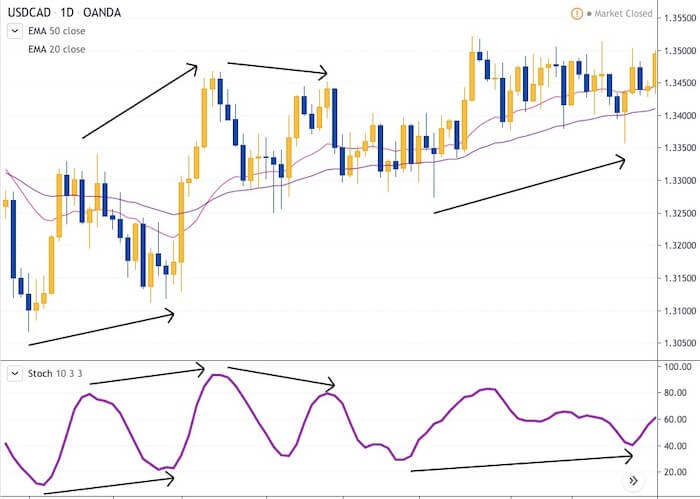
In the chart above, you can see how the Stochastic Oscillator has a very similar wave pattern as the market.
The Stochastic Oscillator’s peaks and troughs match the market’s peaks and troughs.
You can see on the left-hand side of the chart when the market has made a higher low and a higher high…
The Stochastic Oscillator is also showing a higher low and higher high.
After that, the market made a lower high and the Stochastic Oscillator also followed suit.
And towards the right-hand side of the chart, the market is making higher lows and Stochastic Oscillator is also making higher lows.
This is how it should be when the Stochastic Oscillator is moving in tandem with the market.
So when the Stochastic Oscillator matches the highs and lows of the market, there is no divergence.
A divergence only occurs when the Stochastic Oscillator forms a different high or low than the market.

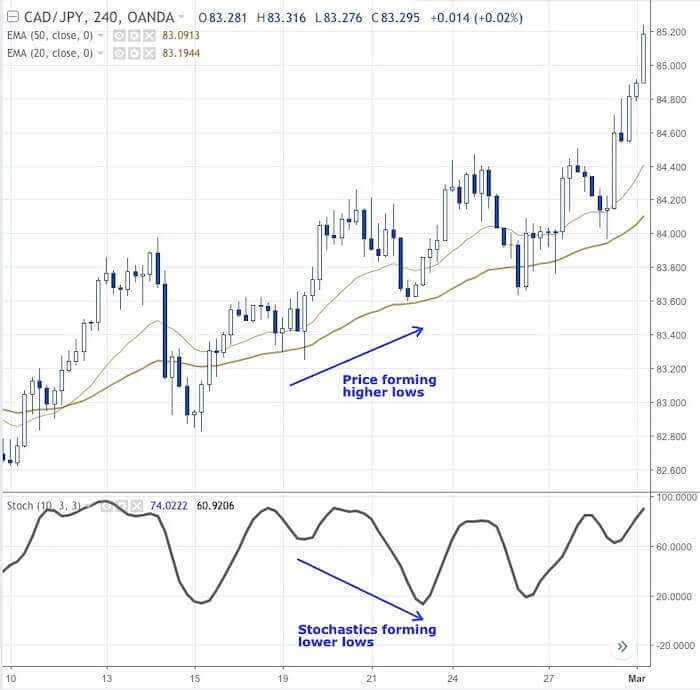
In the chart above, you can see that there are two instances of divergence as marked by red arrows.
The first instance is when the market made a higher high but the Stochastic Oscillator does not follow suit.
Instead, it made a lower high.
After that, the market reversed and started going down.
The second instance is when the market went below the two EMAs and made a lower low but the Stochastic Oscillator made a higher low.
And similarly, after the divergence happened, the market went up.
So what the Stochastic Divergence does is give an early indication as to when the market might be turning.
While it’s reliable when used correctly, it’s not 100% accurate of course.
That means not all divergences will lead to a turn in the market.
And it doesn’t matter because we do not need all of the divergences to work out to be profitable.
With the right risk management and trade management, even if you get less than half of the divergences working for you, you can still be profitable.
Why Use the Stochastic Oscillator?
While there are many different indicators that can identify a divergence in the market…
The one I like to use best is the Stochastic Oscillator.
And the reason is that it gives a clearer divergence signal than other indicators because it has a smoother wave pattern.
For example, here’s how a divergence looks like with the RSI Indicator (using the same chart as above):

Do you see how the RSI Indicator shows a jagged line?
While it gives the same signals as the Stochastic Oscillator, the wave pattern is not as smooth.
Another popular indicator that many traders use to identify divergence is the Moving Average Convergence Divergence (MACD) indicator.
Here’s how a divergence looks like with the MACD:
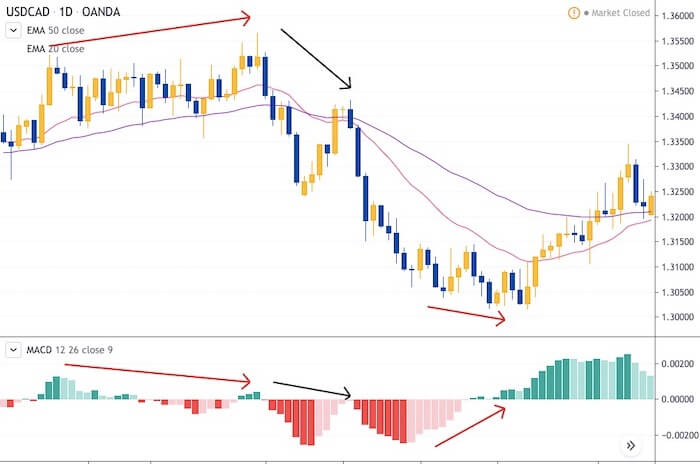
With the MACD, I removed the “MACD” and “Signal” lines to see the divergence on the histogram more clearly.
As you can see, it produces the same signals as well, but it’s still not as easily identifiable as the Stochastic Oscillator.
With the histogram, it can be confusing at times to identify the divergence.
Finally, there’s another indicator that I’ve seen traders use to identify divergence but is not as commonly used…
And that is the On-Balance Volume (OBV) indicator:
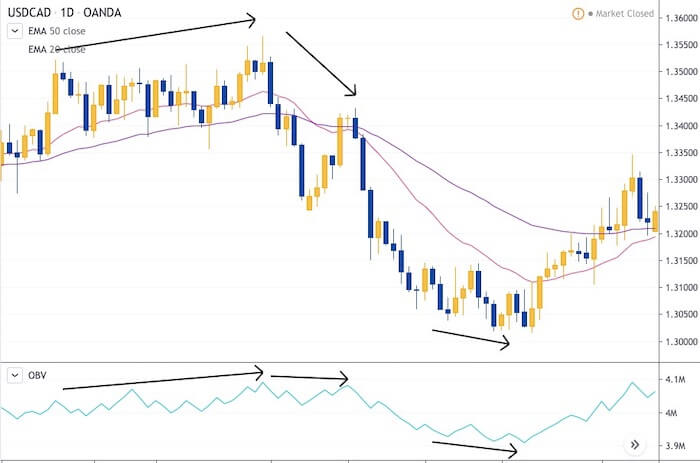
The chart above is the same chart I’ve used with the other indicators.
With the other indicators, they showed the same divergence signals.
But with the OBV, there is no divergence on this chart at all.
That’s because the OBV produces the least number of divergence signals compared to the other indicators above.
Here’s how a divergence looks like with the OBV:
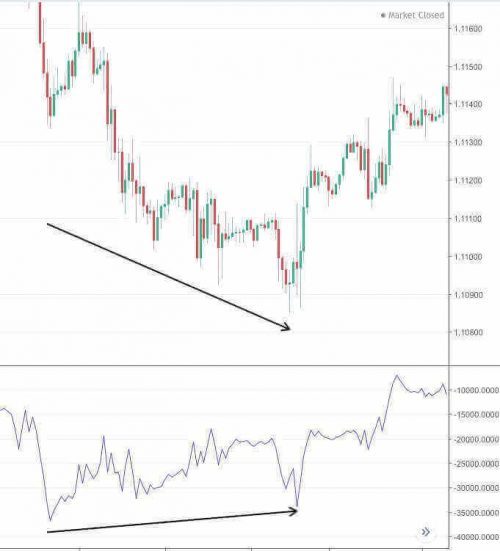
As you can see in the chart above, the OBV is similar to the RSI Indicator where the lines are jagged as well.
That is why of all the indicators, I like the Stochastic Oscillator the best to trade divergence.
It produces the clearest signals of all the indicators making it easier to identify divergence when it happens.
This is important because when a divergence does occur in the market…
It shouldn’t be vague and make you wonder if it really is a divergence.
Instead, it should be easily recognizable once a divergence happens.
Hence I trade the Stochastic Divergence.
How to Identify Divergence Using Stochastic
So first of all, to correctly identify divergence using the Stochastic Oscillator, we want to change the settings from the default settings.
The default for most trading platforms are:
- Length (or Period): 14
- SmoothK (or %K): 1 (or 3)
- SmoothD (or %D): 3
To identify a Stochastic Divergence, what I like to use is the following settings:
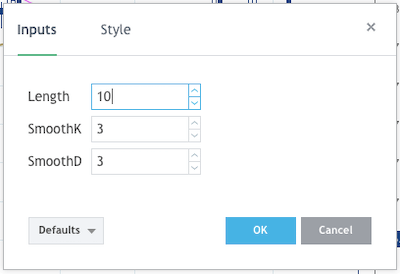
You can see that the settings I’ve used are:
- Length (or Period): 10
- SmoothK (or %K): 3
- SmoothD (or %D): 3
These are the settings that I feel the most comfortable with.
Some traders use a shorter period of 8 or 5.
With a shorter period, you tend to get more frequent signals and can lead to many false divergences.
But if you use a longer period, you tend to get lesser signals and that can lead to having lesser trades overall.
For me, a period of 10 is just nice.
But ultimately, it comes down to your own testing and which works for you.
For our purpose, I will be using the settings of 10,3,3 for the rest of the guide.
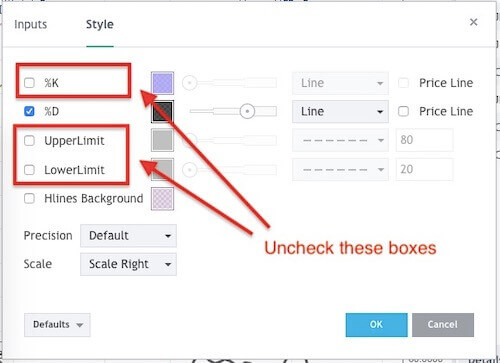
Also, by default, the Stochastic Oscillator will show the “overbought” and “oversold” lines at the readings of 80 and 20, and also show both the %K and %D lines:
If you noticed in the earlier chart examples I used above, there’s only one line.
That’s because I removed the “overbought” and “oversold” lines at the readings of 80 and 20, and also the %K line.
By removing them, it makes the indicator much cleaner for me to identify a Stochastic Divergence.
Now, the reason I remove the overbought and oversold lines is that I don’t use them.
Some traders use these lines to identify overbought and oversold conditions in the market and trade them.
But I solely use the Stochastic Oscillator to identify divergence.
Hence I don’t need those lines.
So to remove them, simply uncheck these boxes in the settings:
And if you noticed, I only chose to use the %D instead of the %K line.
That’s because it is a smoother line.
With a smoother line, you can see the wave patterns more easily.
Now that we’ve got the settings right, let’s get into the different types of divergences.
Two Types of Divergences
Now, when trading divergence, there are two types of divergence to spot using the Stochastic Oscillator:
- Regular Divergence
- Hidden Divergence
Regular Divergence is mostly for trading reversals and is pretty easy to spot once you get the hang of it.
Hidden Divergence, on the other hand, is mostly used for trading pullbacks.
But occasionally, you can find it when trading reversals as well.
Let’s get into the details of both of them.
Regular Divergence
When trading a Regular Divergence, we are looking for reversal chart patterns in the market.
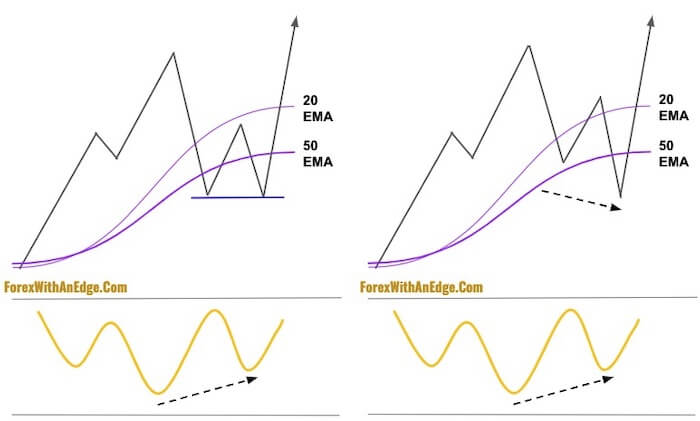
To go Short, we are looking for either a Double Top or a Higher High.
When this is formed in the market, we are looking for the Stochastic Oscillator to form a Lower High for divergence.
This formation can happen in both an uptrend and a downtrend.
In both cases, we only go Short.
And the way I identify whether the market is in an uptrend or downtrend is with the 20 EMA and 50 EMA.
If the 20 EMA is above the 50 EMA, I consider the market to be in an uptrend.
And when the 20 EMA is below the 50 EMA, I consider the market to be in a downtrend.
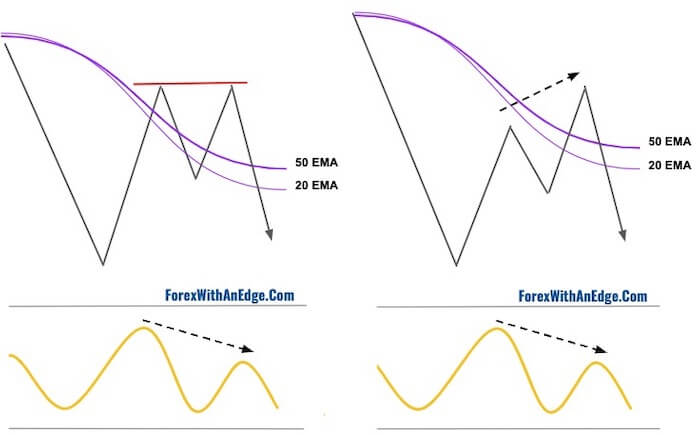
This is how it looks like in an uptrend:

This is how it looks like in a downtrend:
Next, to go Long, we are looking for either a Double Bottom or a Lower Low.
When this is formed in the market, we are looking for the Stochastic Oscillator to form a Higher Low for divergence.
Similarly, this formation can also happen in both an uptrend and a downtrend.
In both cases, we only go Long.
This is how it looks like in a downtrend:
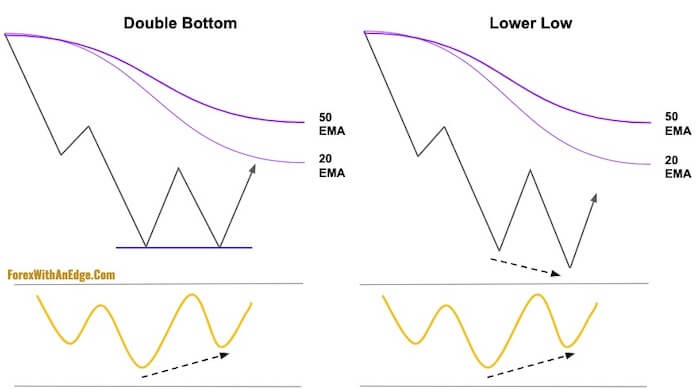
This is how it looks like in an uptrend:
While this may be confusing at first, you will get better at recognizing these patterns as you keep looking at it.
All you need to remember is this…
When you see a Double Bottom or Lower Low, regardless of whether it’s in an uptrend or downtrend, we are only looking to go Long.
And when you see a Double Top or Higher High, regardless of whether it’s in an uptrend or downtrend, we are only looking to go Short.
Hidden Divergence
The second type of divergence is Hidden Divergence.
With Hidden Divergence, the most common way to trade it is with a pullback.
In an uptrend when the market is making a Higher Low, we are looking for the Stochastic Oscillator to form a Lower Low.
When this happens, we are looking to only go Long.
And in a downtrend when the market is making a Lower High, we are looking for the Stochastic Oscillator to form a Higher High.
When this happens, we are only looking to go Short.
Here’s how they look like:
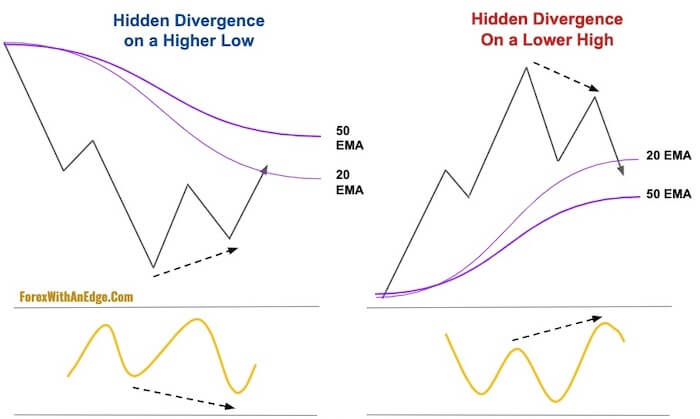
The other way to trade a Hidden Divergence is with trend reversals.
That means when the market is in a downtrend, we are only looking to go Long.
To go Long, we are looking for the market to form a Higher Low, and for the Stochastic Oscillator to form a Lower Low.
In an uptrend, we are only looking to go Short.
To go Short, we are looking for the market to form a Lower High, and for the Stochastic Oscillator to form a Higher High.
Here’s a diagram to show what you’re looking for on the chart:
Now, these two formations don’t happen that often.
But when they do, they can be very high probability trades.
So it’s important to know how to recognize them when they appear on your chart.
How to Trade Divergence Like A Pro
Now that you know what to look for on the charts, let’s get into the specifics on how to trade them.
In total, there are six different setups that I’ve identified to trade divergence.
Three setups to go Long.
And three setups to go Short.
Long Setup #1: Trading Hidden Divergence on an Uptrend Pullback
Here are the entry rules to go Long:
- Look for the market to be in an uptrend. That means the 20 EMA has to be above the 50 EMA, and the market has to be trading above the 20 EMA.
- Wait for the market to do a pullback to either of the EMAs. Then look for the market to close below either of the EMAs.
- Once the market has closed below either of the EMAs, wait for the market to go back up to close above the 20 EMA.
- When the market closes above the 20 EMA, take a look at the Stochastic Oscillator to see if there is a Hidden Divergence formed. If there is, go Long either at the close or place a Buy Limit Order below the close to get a better entry price.
- Then place Stop Loss below the swing low, and place your Take Profit Level at either 1.5R, 2R or use a Trailing Stop Loss.
Let’s take a look at a trade example.
The trade example above is on the USDCAD 4-hour chart.
- The market is in a clear uptrend with the 20 EMA above the 50 EMA. And the market is forming higher highs and higher lows.
- At the higher low where the arrow is on the chart, the market closed below the 20 EMA.
- Then in 3 bars, it closed above the 20 EMA.
- At this point, the Stochastic Oscillator is showing a clear sign of Hidden Divergence. That is our signal to go Long. Either go Long at the close or place a Buy Limit Order at 83.80 or 83.70. In all cases, you would be filled.
- Then place Stop Loss below the swing low at 83.50. This will give you a Stop Loss distance of 20 – 30+ pips depending on where you went Long. If you placed your Take Profit at either 1.5R or 2R, you would have closed your position with a profit.
Long Setup #2: Trading Regular Divergence on a Double Bottom or Lower Low
Here are the entry rules to go Long:
- For this setup, the Double Bottom or Lower Low can appear in both an uptrend or downtrend. So it doesn’t really matter if the Double Bottom or Lower Low is formed in an uptrend or downtrend. As long as it appears and there is divergence we trade it.
- Wait for a Double Bottom or Lower Low to be formed. The second “bottom” or “low” has to be below either of the EMAs.
- Then wait for the market to close above the 20 EMA.
- When the market closes above the 20 EMA, see if there is a Regular Divergence on the Stochastic Oscillator. If there is, go Long at the close or place a Buy Limit Order below the close for a better entry.
- Place Stop Loss below the second “bottom” or “low”. Then place Take Profit Level at 1.5R, 2R or use a Trailing Stop Loss.
Let’s take a look at a trade example in an uptrend:
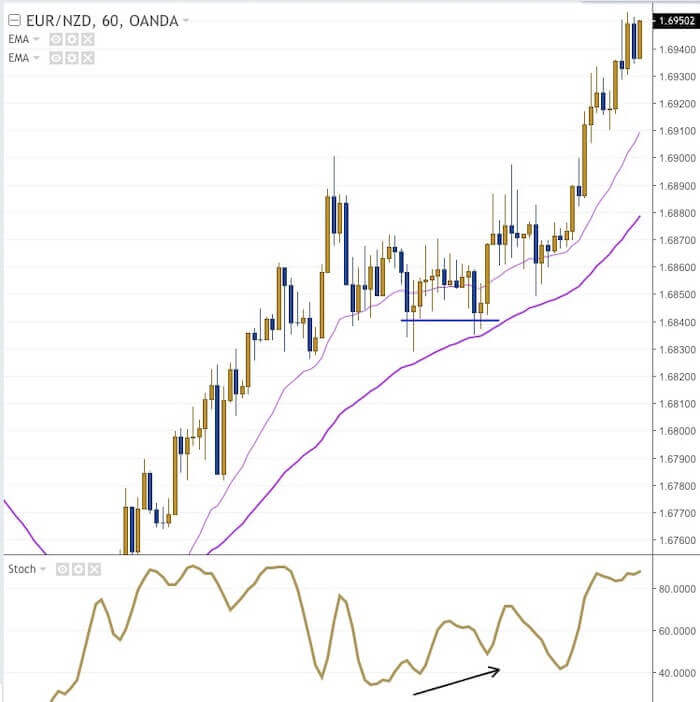
The trade example above is on the EUZNZD 1-hour chart.
- The market is in a strong uptrend. The 20 EMA is above the 50 EMA and the market is trading above the 20 EMA.
- Then the market did a pullback to below the 20 EMA and formed a small Double Bottom with the second “bottom” forming below the 20 EMA.
- The market subsequently closed above the 20 EMA with a Bullish Engulfing Pattern candlestick.
- At that point, the market has formed a higher low indicating a Regular Divergence. Go Long either at the close of the Bullish Engulfing Pattern candlestick, or place a Buy Limit Order below it at either 1.6860 or 1.6850. Both would have been filled.
- Place Stop Loss below the second “bottom” at 1.6825. And if you place your Take Profit level at either 1.5R or 2R, you would have hit both profit targets.
Now let’s take a look at a trade example in a downtrend:

This is a trade example on the USDCHF 30-minute chart.
- The market is in a strong downtrend. The 20 EMA is below the 50 EMA and the market is making a sharp downward move below the 20 EMA.
- The market then did a pullback up to the 20 EMA and the came back down to form a Double Bottom.
- Then in one bar, the market rallied up and closed above the 50 EMA.
- At that point, the Stochastic Oscillator is showing a higher low indicating a Regular Divergence. However, we don’t want to go Long at the close of the long candlestick that closed above both EMAs. Instead, we want to place a Buy Limit Order below it either at the halfway mark of the long candlestick around 0.9875, or at the 20 EMA around 0.9880. In both cases, you would have been filled.
- Then place your Stop Loss below the second “bottom” low at 0.9855 and place your Take Profit level at 1.5R or 2R. Both would have been subsequently hit.
Long Setup #3: Trading Hidden Divergence on a Higher Low in a Downtrend
Here are the entry rules to go Long:
- Look for the market to be in a downtrend. That means the 20 EMA has to be below the 50 EMA, and the market has to be trading below the 20 EMA.
- Wait for the market to form a Higher Low.
- Then wait for the market to close above the 20 EMA.
- When the market closes above the 20 EMA, take a look at the Stochastic Oscillator to see if it forms a lower low for a Hidden Divergence. If there is Hidden Divergence, go Long either at the close or place a Buy Limit Order below the close to get a better entry price.
- Then place Stop Loss below the Higher Low, and place your Take Profit Level at either 1.5R, 2R or use a Trailing Stop Loss.
Let’s take a look at a trade example.

This is a trade example on the USDPY 30-minute chart.
- The market is in a downtrend trading below the 20 EMA. The 20 EMA is below the 50 EMA.
- On the chart where the arrow is, the market made a Higher Low.
- At that point, the Stochastic Oscillator formed a lower low indicating a Hidden Divergence.
- The market then closed above the 20 EMA and that is the signal to go Long. Either go Long at the close around 111.10 or place a Buy Limit Order below at 111.05 or 111.00. If you placed your Buy Limit Order at 111.05, you would have gotten filled. But if you placed it at 111.00, then you would have missed your trade.
- Then place your Stop Loss below the Higher Low at around 110.85 and Take Profit at 1.5R or 2R.
Now that we have finished the Long setups, let’s get into the Short setups.
Short Setup #1: Trading Hidden Divergence on a Downtrend Pullback
Here are the entry rules to go Short:
- Look for the market to be in a downtrend. That means the 20 EMA has to be below the 50 EMA, and the market has to be trading below the 20 EMA.
- Wait for the market to do a pullback to either of the EMAs. Then wait for the market to close above either of the EMAs.
- Once the market has closed above either of the EMAs, wait for the market to come back down to close below the 20 EMA.
- When the market closes below the 20 EMA, take a look at the Stochastic Oscillator to see if there is a Hidden Divergence formed. If there is, go Short either at the close or place a Sell Limit Order above the close to get a better entry price.
- Then place Stop Loss above the swing high, and place your Take Profit Level at either 1.5R, 2R or use a Trailing Stop Loss.
Let’s take a look at a trade example.
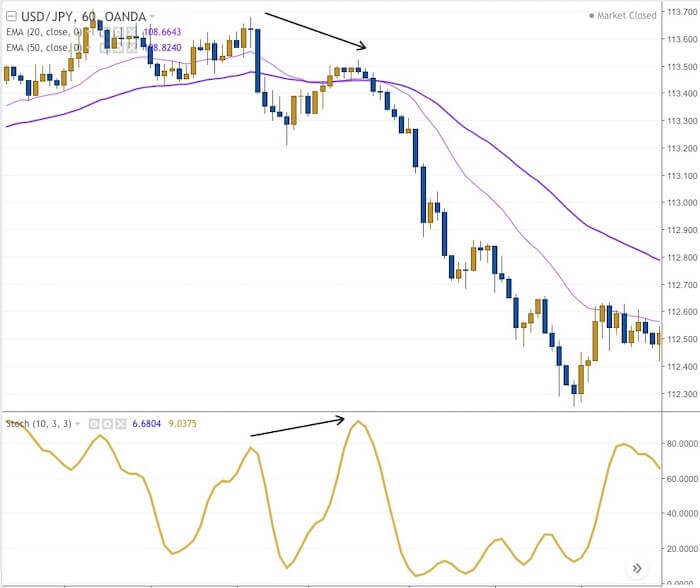
This is a trade example on the USDJPY 1-hour chart.
- On the left-hand side of the chart, the market was still in an uptrend. Then it started to move below both the EMAs and broke below the swing low at around 113.45. The 20 EMA then subsequently moved below the 50 EMA indicating a start of a downtrend.
- At that point, the market did a pullback to close above both EMAs.
- Then the market closed below the 20 EMA forming the first lower high in its downtrend.
- At that point, the Stochastic Oscillator was showing a higher high indicating a Hidden Divergence. So this is our signal to go Short. Since the swing high was very close to where the market closed below the 20 EMA, we can go Short at the close at 113.40 without having to place a Sell Limit Order above the close.
- Then place Stop Loss above the lower high at 113.60. And if you placed your Take Profit level at 1.5R or 2R, you would have taken profit pretty quickly.
Short Setup #2: Trading Regular Divergence on a Double Top or Higher High
Here are the entry rules to go Short:
- For this setup, the Double Top or Higher High can appear in both an uptrend or downtrend. So it doesn’t really matter if they are formed in an uptrend or downtrend. As long as it appears and there is divergence we trade it.
- Wait for a Double Top or Higher High to be formed. The second “top” or “high” has to be above either of the EMAs.
- Then wait for the market to close below the 20 EMA.
- When the market closes below the 20 EMA, see if there is a Regular Divergence on the Stochastic Oscillator. If there is, go Short at the close or place a Sell Limit Order above the close for a better entry.
- Place Stop Loss above the second “top” or “high”. Then place Take Profit Level at 1.5R, 2R or use a Trailing Stop Loss.
Let’s take a look at a trade example in an uptrend:
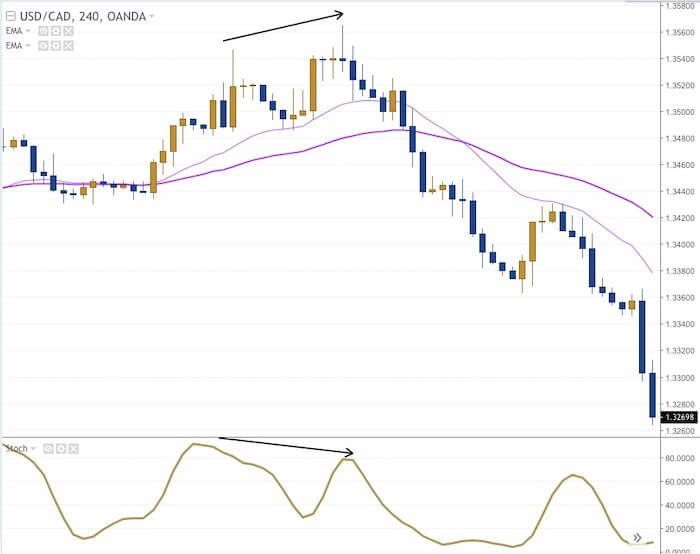
This is a trade example on the USDCAD 4-hour chart.
- From the left-hand side of the chart, the market was in an uptrend and briefly dropping below both the EMAs before going back above it again. The market then broke above the previous swing high at 1.3490 and continued to go up.
- As the market went higher, it formed a Higher High. At that point, a Bearish Pin Bar was formed indicating bearishness in the market.
- The market then subsequently went down and closed below the 20 EMA.
- When the market closed below the 20 EMA, the Stochastic Oscillator showed a lower low indicating a Regular Divergence. To go Short, either enter at the close below 20 EMA at around 1.3500, or place a Sell Limit Order at 1.3510 or 1.3520. Both of which would have been filled.
- Then place Stop Loss above the higher high at 1.3580. The market subsequently went much lower and would have gotten your Take Profit level at 1.5R and 2R.
Let’s take a look at a trade example in a downtrend:
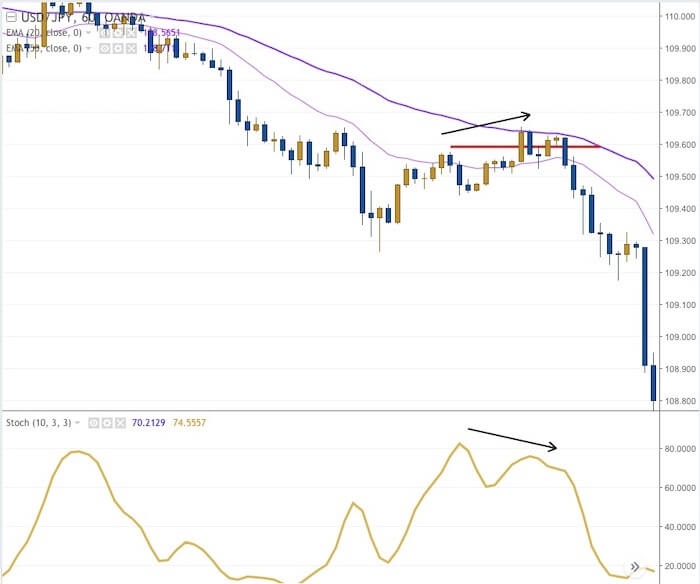
The trade example above is on the USDJPY 60-minute chart.
- From the left-hand side of the chart, the market had been in a downtrend. The 20 EMA is below the 50 EMA and the market has been trading below the 20 EMA for the most part.
- Then the market did a pullback to the 20 EMA and closed above it.
- The market then closed below the 20 EMA shortly after touching the 50 EMA completing the formation of the Higher High.
- At that point, the Stochastic Oscillator was showing a lower high indicating a Regular Divergence. Because the close below the 20 EMA is near the swing high, we want to just go Short right at the close at around 109.55. There’s no need to place a Sell Limit Order above the close as the Stop Loss distance will already be considered pretty tight.
- The Stop Loss is placed above the Higher High at 109.70. Both Take Profit levels at 1.5R and 2R would be hit very shortly after going Short at the close.
Short Setup #3: Trading Hidden Divergence on a Lower High in an Uptrend
Finally, here are the entry rules to go Short for our last setup:
- Look for the market to be in an uptrend. That means the 20 EMA has to be above the 50 EMA, and the market has to be trading above the 20 EMA.
- Wait for the market to form a Lower High.
- Then wait for the market to close below the 20 EMA.
- When the market closes below the 20 EMA, take a look at the Stochastic Oscillator to see if it forms a higher high for a Hidden Divergence. If there is Hidden Divergence, go Short either at the close or place a Short Limit Order above the close to get a better entry price.
- Then place Stop Loss above the Lower High, and place your Take Profit Level at either 1.5R, 2R or use a Trailing Stop Loss.
Let’s take a look at a trade example.

The trade example above is on the USDJPY 30-minute chart.
- From the left-hand side of the chart, you can see that the market is in a downtrend. The 20 EMA is below the 50 EMA.
- Then the market shot up above both EMAs in one candlestick bar and closed above it. Then the market subsequently formed a Lower High. At that point, the 20 EMA also just crossed above the 50 EMA. However, it doesn’t change the fact that we are going Short because the market is still in a strong downtrend from the left-hand side of the chart.
- After that, the market closed below both the EMAs in one bar.
- At the same time, the Stochastic Oscillator is showing a higher high indicating a Hidden Divergence. This is the signal to go Short. Either go Short at the close below the EMAs or place a Sell Limit Order at 108.50. If you placed a Sell Limit Order, you would have missed the trade.
- Stop Loss is placed above the Lower High at 108.65. Both 1.5R and 2R Take Profit levels would be hit.
Summary
If you’ve managed to read this ultimate guide all the way to this point, well done!
You’ve just digested a LOT.
So first of all, give yourself a pat on the back for making it this far!
You’re now way ahead of the majority of traders when it comes to trading divergence.
Next, to help you digest everything in this ultimate guide to trade divergence, here’s a summary of what you’ve just learned:
- The Stochastic Oscillator forms wave patterns of highs (peak) and lows (trough) that mimic the market’s movement.
- Stochastic Divergence is when the market’s highs and lows movement differ from the Stochastic Oscillator’s highs and lows movement.
- The Stochastic Oscillator produces smoother wave patterns than other indicators that can identify divergence. Hence, producing clearer divergence signals.
- There are two types of divergences – Regular Divergence and Hidden Divergence.
- Regular Divergence is on reversal chart patterns like Double Bottoms (and Lower Lows), or Double Tops (and Higher Highs).
- Hidden Divergence is commonly used for pullbacks, but can also be used on reversals with Higher Lows in downtrends and Lower Highs in uptrends.
- There are a total of six trading setups to trade Stochastic Divergence. Three Long setups and three Short Setups.
- Long setup #1 is trading pullbacks with Hidden Divergence in an uptrend.
- Long setup #2 is trading reversal chart patterns like Double Bottoms (and Lower Lows) with Regular Divergence.
- Long setup #3 is trading reversals with Higher Lows and Hidden Divergence in a downtrend.
- Short setup #1 is trading pullbacks with Hidden Divergence in a downtrend.
- Short setup #2 is trading reversal chart patterns like Double Tops (and Higher Highs) with Regular Divergence.
- Short setup #3 is trading reversals with Lower Highs and Hidden Divergence in an uptrend.
This is a lot to take in but once you’ve familiarized yourself with the trade setups, you’ll be able to recognize divergence with ease.
For a start, begin with just one trading setup.
Once you’ve mastered that and have no problems identifying it on the chart, then you can move on to the other setups.
Now I’d love to hear from you…
Tell me – Do you trade divergence, and if so, did you have success trading it?
Let me know in the comments below.
One more thing…
Did you like this post?
If so, would you please share it?
Remember, sharing is caring, and it won’t even take 5 seconds of your time.
So go ahead, click the share button below now 
Thank you sir..the most completed explained about trading divergence and take me to the next level to trade with divergence.. good job wish you have great life