In the world of candlesticks, there are many different bearish candlestick patterns.
However, there are only a few that I’ve found to be really effective when traded the right way.
The Dark Cloud Cover is one of them.
However, many traders trade it the wrong way.
And because of that, they constantly lose money trading this candlestick pattern.
So how do you exactly trade the Dark Cloud Cover?
In this guide, I’ll go into the details of everything you need to know about the Dark Cloud Cover…
You will know exactly how to identify the Dark Cloud Cover correctly…
You will also know how to trade it the right way…
And I’ll also share with you a few trading examples so you know exactly what to look out for on your charts.
What is the Dark Cloud Cover pattern?
The Dark Cloud Cover is a two candlestick bar formation.
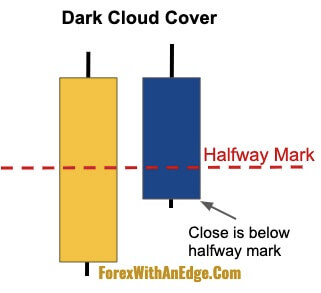
Technicality-wise, the Dark Cloud Cover is a bearish candlestick pattern where the second candlestick’s close has to be below the halfway mark of the first candlestick.
So just by that definition, the first candlestick is always longer than the second candlestick.
Here are the 3 distinct features it has to help you quickly recognize the Dark Cloud Cover:
- A bearish body that makes up the majority of the candlestick.
- Shorter in length compared to the previous candlestick.
- The close is below the halfway mark of the previous candlestick.
Here’s another interesting thing to note about the Dark Cloud Cover…
When you combine the two candlesticks, it always becomes a Bearish Pin Bar.
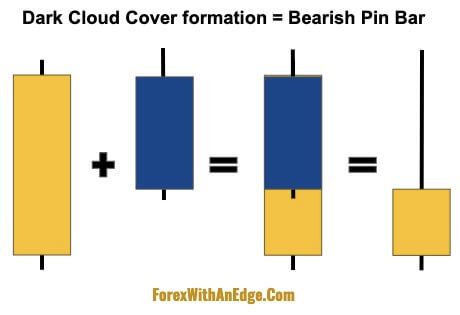
So in essence, a Dark Cloud Cover can also be a Bearish Pin Bar in a higher time frame.
For example, if you see a Dark Cloud Cover on the 30-min chart, then on the 1-hour chart it might be a Bearish Pin Bar.
Okay, now that we know what the Dark Cloud Cover pattern is…
Before we can know how to trade it, we must first get into how NOT to trade it.
How to NOT Trade the Dark Cloud Cover
Before you can know how to trade the Dark Cloud Cover pattern, it’s important to know when to avoid trading it.
While it is considered a reversal candlestick pattern, what you don’t want to do is to trade it by itself.
And what I mean by that is to not trade it every time it appears on your chart.
When trading any candlestick pattern, you want to see the context for its formation.
That means whether there is any chart pattern that accompanies its formation…
Or whether there are any support or resistance levels that make sense for its formation.
As with any candlestick pattern, you only want to trade it with a trade setup.
Then use the candlestick pattern as the entry trigger.
Now that you know how not to trade the Dark Cloud Cover, let’s get into how to trade it the right way.
Dark Cloud Cover Entry Methods
So how do you exactly get into a trade once the Dark Cloud Cover appears?
There are 3 types of entries:
- Entry Method #1: At the close of the Dark Cloud Cover.
- Entry Method #2: At the break of the first bar’s low.
- Entry Method #3: At the close below the first bar’s low.
Let’s get into each one in detail.
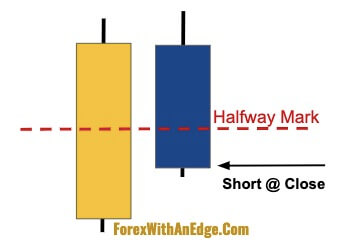
1) Entry Method #1: At the close of the Dark Cloud Cover
The first type of entry is what I consider an aggressive entry.
To enter into a trade using this entry method, you simply wait for the close of the Dark Cloud Cover and then enter into a trade.
That means once the second bar of the formation closes, you immediately go Short using a Market Order.
A Market Order is to take the best available price at any given point in time.
This means to either “hit the bid” or “lift the offer”.
Here’s where you go Short for this entry method:
I consider this an aggressive entry because you do not wait for further confirmation that the market will go in the direction of your trade.
Further confirmation is to wait for the market to either break below the low of the Dark Cloud Cover, or to close below it.
And that leads us to the next two entry methods…
2) Entry Method #2: At the Break Below the First Candle’s Low
The second entry method is to enter into a trade when the market breaks below the low of the first bar in the formation.
Here’s how you go Short using this entry method:
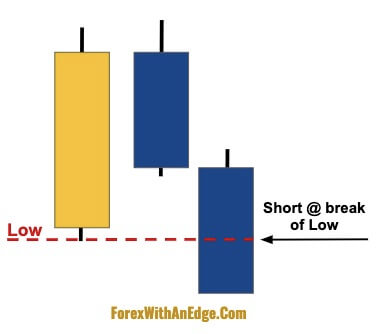
For this entry method, you will be utilizing a Stop Order.
A Stop Order is essentially a Market Order but is only triggered when it reaches the trigger level that you set.
So in this case, the trigger level is below the low of the Dark Cloud Cover.
When the market goes below the low, the order will trigger a market order to sell at the best available price.
3) Entry Method #3: At the Close Below the First Bar’s Low
The third entry method is the most conservative of all.
And that is to wait for a close below the low of the first bar of the Dark Cloud Cover formation to go Short.
Here’s how you go Short with this entry method:
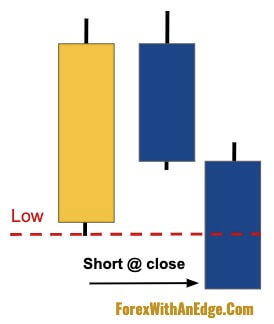
Similar to the first entry method, you enter into a trade using a Market Order.
So that means once the bar closes below the low of the first bar, you hit sell.
The upside of this entry method is that you only enter once you have confirmed that the market is going further down.
However, the downside of this entry method is that your risk-to-reward-ratio won’t be as good as the first two methods.
If you get an entry with this method, it means that you have entered into the trade later than traders using the first two entry methods…
And they would already be in the profit whereas you’re just starting from ground zero.
So how do you decide which entry method you should choose?
How to Decide Which Entry Method to Use
Now that you know the different entry methods, which one do you use?
Let’s compare the 3 entry methods:

Of the 3 entry methods, you can see that the first entry method has the tightest Stop Loss and the biggest risk-to-reward ratio…
And the third entry method has the widest Stop Loss and the smallest risk-to-reward ratio, based on the same Take Profit level.
So just from this diagram alone, the first entry method may seem like the best to use…
But is that really true?
We will have to see the pros and cons of each method to better evaluate all three entry methods.
So here are the pros and cons of using each method…
Entry Method 1
Pros:
- Can get a better risk-to-reward ratio for the same Take Profit level.
- A much tighter Stop Loss than the other two entry methods.
Cons:
- Get stopped out more often than the other two entry methods.
Entry Method 2
Pros:
- A better risk-to-reward ratio than the third entry method.
- Don’t get stopped out as often as the first entry method.
- A balance between entry methods 1 and 3.
Cons:
- A worse risk-to-reward ratio than the first entry method.
- Get stopped out more often than the third entry method.
Entry Method 3
Pros:
- Do not get stopped out as often as the first two entry methods. If the first two methods get stopped out immediately after getting into a trade, you won’t be affected because you wouldn’t be in the trade if the market did not close below the first bar.
Cons:
- The worst risk-to-reward ratio of the 3 entry methods for the same Take Profit level.
- To get the same R-Multiple profit as the first two entry methods, the market has to travel further from the entry point. For example, sometimes the market might hit the 2R Take Profit level for the first two entry methods, but then reverse immediately and hit the Stop Loss. That means the first two methods would have a 2R profit, but this method would have a 1R loss.
So as you can see, all three entry methods have their pros and cons and that’s the trade-off for each of them.
It’s up to you to decide which entry method is more suitable for your trading style.
Some traders prefer a bigger risk-to-reward ratio and don’t mind getting stopped out more often…
While some traders don’t mind a smaller risk-to-reward ratio as long as they don’t get stopped out as often.
I prefer the third entry method as I don’t get as many false signals…
But instead of entering at the close of the bar, I place a Limit Order above the close like this:
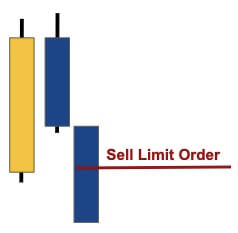
So if the candlestick that closed above the first bar closes at 100.50, I may choose to place a Sell Limit Order anywhere above it.
This is a more advanced entry method and not necessarily for everyone.
The upside to this is that I can have a much better risk-to-reward ratio than if I were to go Short at the close of the bar below the first bar.
However, the downside to this entry method is that I can miss trades that would have otherwise been profitable.
For example, after the candlestick closes below the first bar of the Dark Cloud Cover pattern, the market might just continue going down and never come back up to fill my Sell Limit Order.
But I’m fine with that.
So it comes down to you to decide which is the best entry method that’s the most suitable for your trading style.
Now that you know the 3 entry methods, it’s time to get into the specific trading setups.
How to Go Short With the Dark Cloud Cover
To trade the Dark Cloud Cover pattern, there are two setups that you can use:
- Pullbacks in a Downtrend
- Double Tops
Pullbacks In A Downtrend
In a downtrend, the market will make Lower Highs and Lower Lows like this:

These Lower Highs are the pullbacks in a downtrend.
What I’m looking for is for the Dark Cloud Cover pattern to form on these Lower Highs.
But we don’t want to trade every Dark Cloud Cover that forms on a Lower High.
We only want to trade the ones that are formed on a dynamic resistance level.
What is a dynamic resistance level?
They are resistance levels formed by moving averages.
More specifically, Exponential Moving Averages.
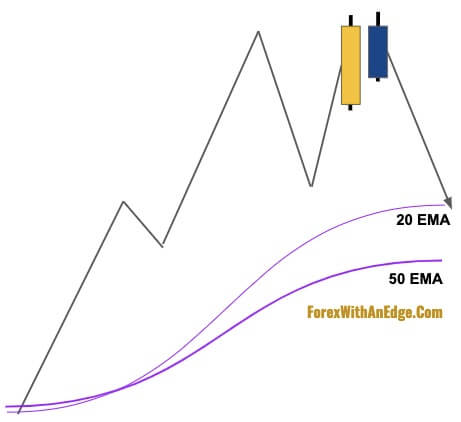
So what I like to do is plot the 20 EMA and 50 EMA on my chart…
And what I’m looking for are the Dark Cloud Cover patterns that form on either of these EMAs like this:
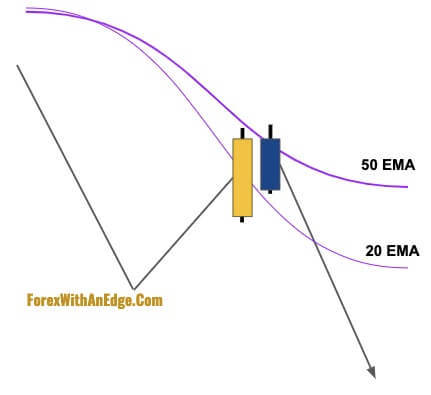
Let’s take a look at a trading example:
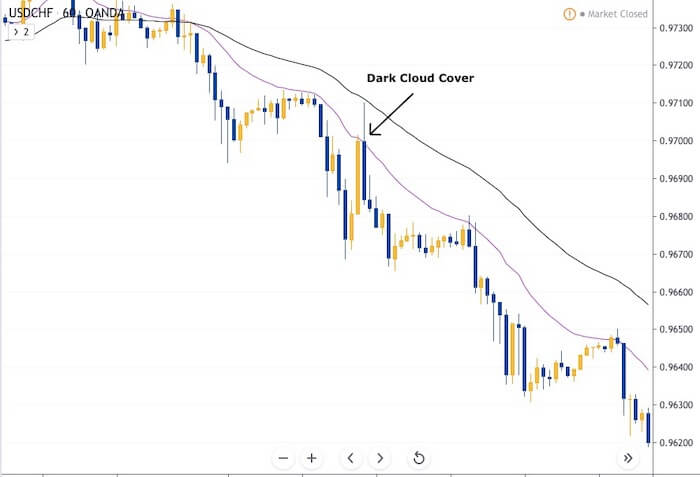
This is on the USDCHF 1-hour chart.
The market is in a downtrend forming lower lows and lower highs with the 20 EMA below the 50 EMA.
As you can see, the market is trending pretty strongly downwards as it’s trading below the 20 EMA.
Right after the 20 EMA crossed below the 50 EMA, the market did its first pullback to the 20 EMA and then came back down.
It then did another pullback to the 20 EMA and this time formed a Dark Cloud Cover.
On the second candlestick of the Dark Cloud Cover formation, the market had tried to go above the 20 EMA…
However, the market got pushed back down to close below the 20 EMA.
This is a bearish sign and shows that the 20 EMA held up as a dynamic resistance level.
After the Dark Cloud Cover was formed, the market started to steadily go further down.
Double Top
The Double Top is a bearish reversal signal and it is usually found at the top of an uptrend.

For a Double Top to form in an uptrend, it’s always above the two EMAs.
However, a Double Top can also be found in a downtrend like this:

Both Double Tops are tradable.
However, I found that when a Double Top appears in a downtrend, the probability of it working out is higher.
But it’s rarer to come by compared to Double Tops that form in an uptrend.
What we’re looking for is for the Dark Cloud Cover to form on the second “top” like this:
Let’s take a look at an example:

This is on the USDJPY 1-hour chart.
From the left-hand side of the chart, the market was trading in an uptrend.
The 20 EMA was still above the 50 EMA and the market formed a Double Top.
At the second “top” the market formed a Dark Cloud Cover pattern.
This was the signal to go Short.
After the Dark Cloud Cover was formed…
The market started to form lower lows and lower highs breaking the uptrend wave pattern.
Shortly after, the 20 EMA crossed below the 50 EMA and the market started to trade below both the EMAs.
As you can see, this Double Top with the Dark Cloud Cover formation was the turning point of the market.
The market’s uptrend reached its peak at the Double Top and then started to transition into a downtrend from there.
While it’s not always you can find the exact turning point of the market…
When you trade the Double Top with a Dark Cloud Cover formation, there’s a chance that can happen.
Let’s take a look at a Double Top in a downtrend:
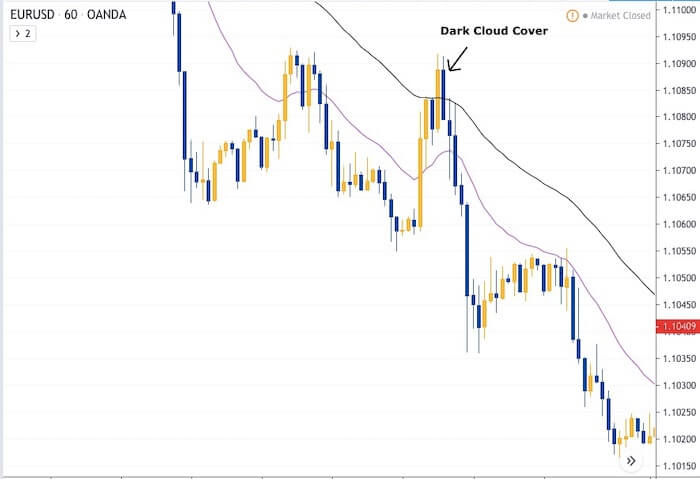
This is on the EURUSD 1-hour chart.
As you can see on the chart, the market has been in a downtrend making lower lows and lower highs.
During the first pullback, the market went up to the 20 EMA and then came back down forming a lower low.
Then it went back up again to the 50 EMA and formed a Double Top.
At the second “top”, a Dark Cloud Cover pattern was formed.
The market then started to go down pretty quickly after that.
This is a high probability trade because not only was the Dark Cloud Cover formed on a Double Top…
But it also formed on the 50 EMA, which served as a dynamic resistance level.
So that is a confluence of resistance making the trade a high probability trade.
Conclusion
Now that you know how to trade the Dark Cloud Cover, it’s time to take what you’ve learned here and apply it in your trading.
Remember, never trade the Dark Cloud Cover as a standalone.
In fact, never trade any candlestick pattern just by themselves.
Instead, you only want to use them as an entry trigger to get into your trade setups.
One more thing…
Did you like this post?
If so, would you please share it?
Remember, sharing is caring, and it won’t even take 5 seconds of your time.
So go ahead, click the share button below now 
Great content! Super high-quality! Keep it up! 🙂
Thanks.
This is an honest trader! Thanks for sharing.