
Did you know that the Forex market constantly creates the same patterns over and over again?
What if you could immediately recognize these recurring patterns and take advantage of it?
But here’s the catch…
If it were really that easy, then everyone would rich.
But that’s not the case.
That’s because there are patterns that have a high probability of working out…
And then there are the patterns that have a low probability of working out.
You see, what trading essentially is about is finding patterns that reoccur over and over again.
And one of the big differences between the profitable traders and the losing traders is the ability to recognize the high probability patterns from the low probability ones.
And that’s what I want to share with you in this post…
The 6 high probability reversal patterns that happen time and time again in the Forex market.
Why Trade Reversals
If you categorize all the different types of trading setups that there is in the world, they only come down to just two types of trading:
- Trend Trading – that means you trade in the direction of the trend like trend following systems.
- Countertrend Trading – that means you trade against the trend like trading reversals and mean reversion strategies.
And of these two types, countertrend trading strategies like trading reversals can be more lucrative because you are catching the beginning of a trend.
Whereas when trading with the trend, you’d already have to wait for the trend to be established before you enter into a trade.
That means with reversal trading, you can get better entries.

In the chart above, you can see that if you traded a reversal pattern, you would have gotten in earlier into the trade compared to if you had waited for a trend to form and entered on a pullback.
And assuming both have an exit criterion to get out of the trade when the market closes below the higher period Exponential Moving Average (EMA), you would have made more with the reversal trade.
With that said, you can’t really compare a reversal trade against a pullback trade just by basing it on which has a better entry.
We still have to consider that you might get stopped out of a reversal trade even before you get into a pullback trade.
Or you might have gotten out of a reversal trade even before the pullback trade occurs.
So instead of trading just either reversals or pullbacks, you should have both trading setups in your trading arsenal.
With that said, there are 6 reversal patterns that happen in the Forex market over and over again.
These can be high probability setups when you trade them the right way.
And these can be very profitable if you trade them the right way.
So you want to imprint these 6 Forex reversal patterns into your head.
Three of them form in an uptrend.
And three of them form in a downtrend.
How to Identify Trends
In order to trade reversals, you need to first know how do you spot a trend.
Only then will you know which direction to take a trade in.
If the market is in an uptrend, then a reversal trade means you are looking to go Short (which means to sell).
And if the market is in a downtrend, then a reversal trade means you are looking to go Long (which means to buy).
When the market is in an uptrend, it will form higher highs and higher lows like this:

And if the market is in a downtrend, it will form lower lows and lower highs like this:

Additionally, we also want to add two indicators to give us a very quick way to view if the markets are trending up or down.
And these two indicators are the 20 EMA and 50 EMA.
For our purpose, the 20 EMA and 50 EMA will serve as our trend indicator.
When you plot these two indicators on the charts, it will let you very quickly identify whether the market is going up or down in general.
So if the 20 EMA is above the 50 EMA and forming higher highs and lows, we will consider the market in an uptrend.

And if the 20 EMA is below the 50 EMA and forming lower low and highs, we will consider the market in a downtrend.

But if the EMAs are constantly crossing each other in a short period of time, and the market is forming an irregular pattern of highs and lows, then the market is considered to be moving sideways.

Now, that we have an objective way of identifying whether the market is in an uptrend, downtrend or moving sideways, let’s get into the reversal patterns.
Reversal Patterns In An Uptrend
To trade a reversal in an uptrend, we only want to go Short.
So we are looking for Short reversal patterns.
Here 3 reversal patterns that we want to look for:
- Double Tops
- Higher Highs
- V-Bottoms
Double Tops
A double top is when the market is forming an “M” shape.

Sometimes the 2nd top can be slightly higher than the 1st top.
Sometimes it can be lower than the 1st top.
But both tops have to be relatively at the same high.
So how do you decide whether a double top is a double top?
Take a look at these two double tops:

The double top on the left makes just a small pullback, whereas the one on the right makes a deeper pullback.
I call these pullbacks in between the double top a “valley”.
I find that the double top with a deeper valley has a higher probability of a reversal.
Whereas the double top with a shallower valley is still showing strength in the move up, so it might still have a strong momentum upwards.
As a general rule of thumb, I want to see double tops where the valleys go below the 20 EMA (the chart on the right-hand side).
But take note that this is just a general rule and should be taken case by case.
Because sometimes even when the valley goes below the 20 EMA, it might still be a shallow valley.
Sometimes, the valley may not even touch the 20 EMA and it can still be considered a deep valley.
So ultimately, the best way is to use your eyes to guide you on whether the valley is deep enough or not to be considered a good double top or higher high pattern.
Higher Highs
Higher highs are very similar to double tops, except that the 2nd top must be higher than the 1st top.
By now, you should already know what a higher high is as it is what forms an uptrend.

With the double top, we know that we want both of the tops to be of similar high.
But with a higher high, the 2nd high can be significantly higher than the 1st high.
So how do we determine whether the higher high is a valid formation to get into a reversal trade?
Similarly to identifying double tops, we use our eyes to gauge it.
Basically, what we want to look out for is a 2nd high that is not too far off from the 1st high…
And again, as a general rule of thumb, we want the valley (the dip between the two highs) to be below the 20 EMA, or relatively deep enough.

In the image above, you can see that on the left-hand side chart, the valley is much shallower than the valley on the right-hand side.
We want a valley that’s more like the right-hand side because it signifies that the momentum isn’t as strong as compared to the chart on the left-hand side.
The deeper the valley, the weaker the momentum of the trend.
The weaker the momentum of the trend, the stronger the possibility of a reversal.
How to Trade Double Tops & Higher Highs
Since both the double top and higher high are very similar, we will trade them both the same way.
There are 3 ways to enter into a trade:
- Break Below Neckline
- Resistance Levels & Bearish Candlestick Pattern
- Stochastic Divergence
Break Below Neckline
The first way to trade a double top is the traditional technical analysis way.
Once the market has formed a double top or higher high, go Short at the break of the neckline (which is also the low of the valley).

Resistance Level & Bearish Candlestick Pattern
The next way to trade a double top or higher high reversal is to see if the 2nd top hits a resistance level.
Then see if a bearish candlestick pattern is formed.
If it’s formed, go Short when the market closes below the low of the bearish candlestick pattern.

On the left-hand side of the chart above, the market made a swing high at 79.90.
Towards the right-hand side fo the chart, you can see that the market re-tested this level at the higher high.
As it tested that resistance level, it formed a Bearish Pin Bar.
In the next bar, the market closed below the Bearish Pin Bar and that is our signal to go Short.
Alternatively, you could wait for the market to go back up to the halfway point of the long candlestick to go Short.
This way you can have a better risk-to-reward ratio.
However, you may miss trades when the market doesn’t go back up and continues to go down.
So this all comes down to your trading style.
Stochastic Divergence
This is my favorite way to trade reversals.
I won’t go into the details of how to trade divergence because I’ve written a detailed explanation of it in this post on divergence and hidden divergence >>
For trading double tops and higher highs, we are looking for the stochastic indicator to form lower highs.

In the chart above, the market is trending steadily upwards before forming a double top.
The valley of the double top also looks deep enough, and the stochastic indicator is making a lower high.
This gives us a valid Short reversal trade.
To go Short, we either wait for a close below the EMA.
An aggressive entry would be to go Short at the close below the 20 EMA.
A conservative entry would be to wait for a close below the 50 EMA to go Short, or wait for the market to retrace back half of the distance before going Short.
Then place Stop Loss a few pips above the high of the double top.
Here’s a chart of divergence on a higher high:

In this chart above, the market formed a higher high but the stochastic indicator is making a lower high.
Similarly, entry is either to go Short at the close below the 20 EMA or the 50 EMA.
Then place Stop Loss a few pips above the higher high.
As you can see on the charts, although the market did go back up after going down to around 107.00, it never went above the previous swing high and the market started to go back down again.
V-Tops
V-Tops are formed when the market makes a sudden big move upwards followed by a move back down.
Most of the time, V-Tops are either caused by some high-impact news on the currency pair.
Sometimes, it could be the big market players like the banks and hedge funds moving the market a relatively short distance to hit obvious Stop Losses.
Manipulation happens in all markets by players who have money.
Banks have the ability to move the market by the sheer size of their trades, especially at times when the market is quiet and illiquid.
The market moves not because there is a lot of buyers or sellers.
Instead, the market moves because of the size of the position.
One bank trader with a 1,000 lot sell order can push the market down against one hundred traders with a 1 lot buy order.
Yes, I know it might seem ridiculous and impossible that the Forex market can be manipulated but this was what bank traders told me they did when I was a prop trader.
When I was at the equities desk at the prop firm, we would manipulate the order book all day long.
So manipulation happens.
Whether it also happens in the multi-trillion-dollar Forex market or not, what matters is that we are ready to take advantage of the move when it happens.
How to Trade V-Tops
If you look at the charts, you will see that many times the market will form an inverse-V pattern.
We call these V-Tops and there are two ways to trade it:
- Resistance Levels & Bearish Candlestick Pattern
- Close Below Resistance Levels
Resistance Levels & Bearish Candlestick Pattern
Similar to double tops & higher highs, we also can go Short on a V-Top pattern when it forms a bearish candlestick pattern at a resistance level.

Close Below Resistance Levels
Sometimes a bearish candlestick pattern might not form when the market hits a resistance level.
But that does not mean we cannot go Short.
The way to go Short would be to wait for the market to close below the resistance level.

In the chart above, the market broke above the previous swing high and then consolidated for a bit before going down again.
When the market finally went below the resistance level, we go Short at the close of the candlestick.
Stop Loss is placed above the high of all the reversal patterns in an uptrend.
Reversal Pattern In A Downtrend
Now that you know the reversal patterns in an uptrend, identifying the reversal patterns in a downtrend is basically just a mirror image.
If you have no problems identifying a reversal pattern in an uptrend, you will have no issues identifying reversal patterns in a downtrend.
Double Bottoms & Lower Lows
The first reversal pattern to get yourself familiar in a downtrend is a double bottom.
While the double top forms an “M” shape, the double bottom forms a “W” shape.

And here’s how a lower low looks like in a downtrend:

How to Trade Double Bottoms & Lower Lows
Similar to trading double tops and higher highs, we enter into a Long trade using these 3 methods:
- Support Levels & Bullish Candlestick Pattern
- Break Above Neckline
- Stochastic Divergence
Since trading the double bottoms and lower lows are just the exact opposite of double tops and higher highs, I will just go through the chart examples to show you the trade entries.
Support Levels & Bullish Candlestick Pattern

On the left-hand side of the chart, the market formed a swing low.
This swing low was later tested when the market formed a lower low.
It immediately formed a Bullish Engulfing Pattern in the next bar and this signifies that the support level is strong.
Go Long either at the close of the Bullish Engulfing Pattern, or wait for a retracement to the midpoint of the candlestick.
Break Above Neckline

In the chart above, the market formed a double bottom and it tested the neckline once.
After that, the market went back up and closed above it.
That will be our signal to go Long.
Again, you can either go Long once the candlestick closes, or wait for a retracement back to the midpoint of the candlestick.
Stochastic Divergence

On the left-hand side of the chart, the market formed a lower low and the stochastic indicator is forming a higher low indicating a divergence.
For an aggressive entry, wait for the market to close above the 20 EMA and go Long.
For a conservative entry, wait for the market to close above the 50 EMA and retrace back to the halfway point of the whole move up.
Stop Loss is placed below the low of the lower low.
V-Bottoms
Like V-Tops, V-Bottoms are price spikes in the market mostly because of news, manipulation, or technical breakouts.
How to Trade V-Bottoms
Similarly to V-Tops, there are two ways to trade V-Bottoms:
- Support Levels & Bullish Candlestick Pattern
- Close Above Support Levels
Support Levels & Bullish Candlestick Pattern

Close Above Support Levels

In the chart above, the market formed a Bullish Pin bar a few bars after breaking below the previous swing low.
However, the candlestick that closed above the Bullish Pin Bar was not above the previous swing low.
In this case, we wait until the market closes above the previous swing low to go Long.
Where To Place Take Profit Levels
Let’s do a quick recap of what we have covered so far:
- The 3 reversal patterns in an uptrend.
- How to go Short for each of the reversal patterns.
- The 3 reversal patterns in a downtrend.
- How to go Long for each of the reversal patterns.
- Where to place your Stop Loss for each of the 6 reversal patterns.
The only thing left now is where to place your Take Profit level.
The reason I did not tell you where to place your Take Profit level in each of the reversal patterns is because every trader has their own trader style.
You see, placing Take Profit levels is like an art and science.
Because there’s more than one way to place your Take Profit level.
So instead of telling you where to place it, I will give you a few strategic places to place your Take Profit level.
Here are 3 proven ways to place your Take Profit level:
- Place it at a fixed R-Multiple (i.e. 1.5R, 2R, 5R, etc).
- Place it at support and resistance levels.
- Use a Trailing Stop Loss to get you out of your trades.
What you want to do is to test each of them and see which works best for your personality.
Now that you know all the 6 Forex reversal patterns, don’t immediately go sell all your personal assets and trade these patterns…
Because there’s one more very important thing you need to understand to trade these patterns profitably…
Multiple Timeframe Analysis
You see, not all reversals are created equal.
If you see a double bottom formed and all the stars have lined up telling you to go Long, how can you know whether it has a good chance of working out?
The answer – by using a higher timeframe.
Let’s walk through an example to illustrate what I mean.
Take a look at this chart 30-min chart of AUDUSD below:
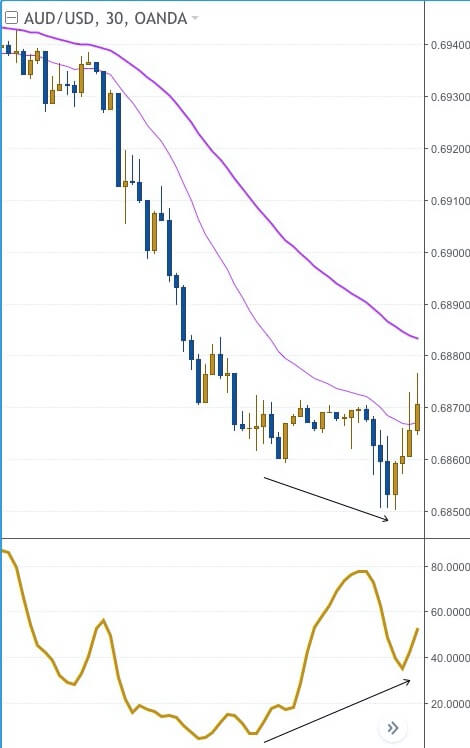
You can see that a double bottom has just formed.
There is a stochastic divergence.
And the market has just closed above the 20 EMA.
Look ripe to go Long yes?
But before you do, you’re interested to see what the higher timeframe looks like.
So you pull up the 4-hour chart side-by-side and you saw this:

You see that on the 4-hour chart, the market is in a strong downtrend.
Does this now look like a trade you want to get into?
Not if you want low probability trades.
While it can work out, the odds are against us because it’s against the trend on the bigger timeframe.
Although we are trading reversals, we want to be trading in the same direction of the bigger timeframe.
Now, you might be saying:
“Woah, Woah, Woah, Davis! We are trading reversals. Trading against the trend is the whole idea of reversals! So why are you suddenly saying that the odds are against us now that we’re trading against the trend?”
Okay, first of all, relax and hold on to your panties…
(I’m not interested to see your Bearish Pin Bar :))
Next, let me explain what I mean by trading with the trend of the bigger timeframe…
So although we are trading reversals, we are trading reversals on the smaller timeframe which serves the bigger timeframe.
Now, imagine that the same double bottom appeared on your 30-minute chart for two different currency pairs.
But you’re only able to go Long on just one of them.
So you decide to pull out the 4-hour chart of both currency pairs and you see this:

If you could only go Long in one of these two currency pairs, which would you choose?
Obviously currency pair B, right?
That’s because currency pair B is already in an uptrend and you’re planning to go Long.
So here’s the key to high probability trades when trading reversals…
We only want to trade reversals that serve the bigger picture of the trend.
That means if the bigger timeframe is in an uptrend, then we only want to look for Long reversals in the smaller timeframes.
And if the bigger timeframe is in a downtrend, then we only want to look for Short reversals in the smaller timeframes.
So there you have it…
These are the 6 Forex reversal patterns that happen over and over again.
Burn all these reversal patterns into your mind so that when the market forms these patterns, you’re able to recognize it immediately and plan the trade.
So do tell me in the comments below – which of the reversal patterns do you have success with at the moment?
I’d love to hear about your experiences!
One more thing…
Did you like this post?
If you liked this post or felt it was helpful for you, would you please share it?
Remember, sharing is caring, and it won’t even take 5 seconds of your time.
So go ahead, click the share button below now to help more traders get an Edge trading the Forex market 
Nice Article