
Wish you knew exactly when a trend is going to continue?
Or wish you knew exactly when the trend will end and start reversing?
Let me let you in on a little secret…
…It’s impossible to know exactly when a trend will continue, or when it will end!
And if anyone says they know with 100% certainty when the trend will continue or end, then stay as far away as possible from that person because you will 100% go broke listening to him.
Sorry to disappoint you if you thought there was a surefire way to “predict” the market.
But that’s the cold hard truth.
However, if you want the next best thing, then you need to know how to trade divergences.
Why Trade Divergence
Trading divergences is one of the most powerful trading strategies when trading the Forex market (or any market for that matter).
In fact, it is one of the proven strategies that my proprietary trading firm used (when I was a proprietary trader there many years ago).
When I was at the proprietary trading firm, traders would trade divergence through a form of trading called spread trading.
Spread trading involves trading two correlated instruments.
And when they diverge from each other, you go Long in one and Short the other.
This type of trading is called non-directional trading because you are taking simultaneous trades in both directions.
However, divergence trading isn’t just limited to spread trading.
It can also be used in directional trading as well.
And the reason many professional traders trade divergence is because divergence trades have a high probability of working out in your favour more often than not (with the right trade management of course).
When you trade divergence, you will be able to confidently get into trades even when the trend has been going on for a substantial amount of time and may seem overextended…

In the chart above, you would be able to get into two Long trades (depicted by the green arrows) based on divergence.
Using divergence, you would also be able to get into this Short reversal trade (depicted by the red arrow below)…

I hope you’re getting excited already because identifying divergences correctly can lead to some really good trades that have good risk-to-reward ratios.
So let’s get to it.
What Exactly is Divergence?
Take a look at this chart.

At this point, it’s very tempting to think that the market is going to continue to go down because it’s obviously in a downtrend forming lower highs and lower lows.
But let’s take a look at what the stochastic indicator is indicating at the right of the chart:

As you can see, on the right-hand side of the chart price is forming a lower low, but the stochastic indicator is showing a higher low instead.
This is called a divergence.
The divergence is where the indicator is moving in the opposite direction of price.
What does that mean?
It means there is a possibility (not a 100% certainty) that the trend might be ending, and a reversal is coming.
And true enough, as you see in the chart below, the price has reversed and gone up after the divergence happened.

As you can already probably tell, trading divergences can be very powerful.
Imagine you had already taken a Short trade earlier and riding the trend down.
Then you see the divergence formed on the stochastic indicator.
At this point, you can consider getting out, or at least closing out half of your position and letting the other half run.
Because of the divergence, you would be able to get out very close to the low where the divergence was formed.
And if you’re flat (meaning you have no trades on), you can consider getting into a Long trade at this point.
Alright, let’s get into the nuts and bolts of how to trade divergences.
How to Trade Divergences Like A Pro
To trade divergence, you simply need two things – price and an indicator to identify the divergence.
There are several indicators that can help you identify divergence in the market:
- Slow Stochastic Oscillator
- Relative Strength Index (RSI)
- MACD
- On Balance Volume (OBV)
But in this post, I’m only going to be talking about the slow stochastic oscillator because it’s the indicator that I find the easiest to identify divergences.
The good news is that the slow stochastic indicator is readily available for use on most trading platforms like MT4, CTrader and also charting software like TradingView.
So there’s no need to download (or pay for) any custom indicators just to trade divergence.
For the purpose of this post, we will identify divergence using the slow stochastic indicator with the following settings:
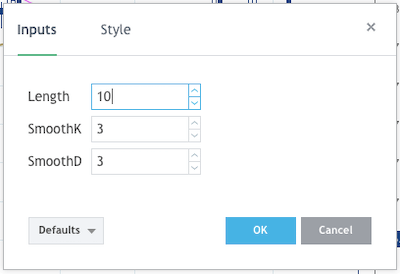
Now, the stochastic oscillator is also used to identify “Overbought” and “Oversold” conditions in the market.
This is usually used when the market is trading in a range.
But for our purpose of trading divergence, we will not be using it because there’s no need to.
Hence, we will remove the Overbought and Oversold lines, and also make %K invisible so we only get to see %D as on the charts.
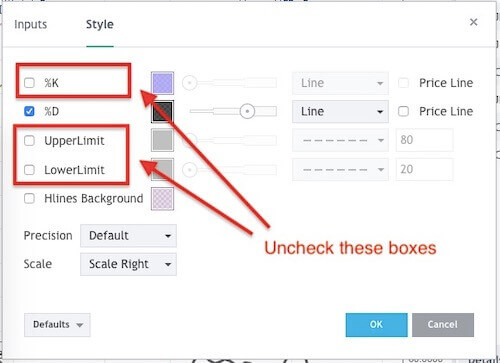
To simply remember this, all you have to do is remember my name “Davis” and keep the %D 🙂
Now, the above images is taken from the Trading View platform.
But most trading platforms should also allow you to remove the %K and the Upper and Lower Limits as well.
Once you have this setup, it will look like this:

Now, when it comes to trading divergence, there are 2 types of divergences:
- Regular Divergence
- Hidden Divergence
By the way, there’s no need for you to memorise whether a chart is a regular divergence or a hidden divergence.
Nobody is going to award you a prize if you get it correct, or punish you if you get it wrong.
All you need to know is that there’s a divergence between the indicator and price.
With that said, let’s get into the two types of divergences.
Regular Divergence
Regular divergence is when you are want to spot a reversal in the current market trend.
So when the market is trending down, you are looking for a bullish divergence.
That means the market is making lower lows or double bottoms, but you are looking for higher lows on your stochastic indicator.
Let’s take a look at a couple of chart examples.
Regular Bullish Divergence on USDJPY

In the chart above, you can see that price is making lower lows, but the stochastic indicator is making higher lows.
Regular Bullish Divergence on USDCHF

Same thing here for USDCHF.
You can see that price is making lower lows, but the stochastic indicator is making higher lows.
For bearish divergence, it’s the opposite.
When the market is trending up, you are looking for a bearish divergence.
That means the market is making higher highs or double tops, but you are looking for lower highs in your stochastic indicator.
Let’s take a look at a couple of bearish divergence examples below.
Regular Bearish Divergence on USDJPY

In the chart above, you can see that price is making higher highs, but the stochastic indicator is making lower highs.
Regular Bearish Divergence on EURUSD

For this chart of EURUSD, the price has made a double top and the stochastic indicator is confirming that this is a double top reversal by forming lower highs.
Alright, let’s get into hidden divergences now…
Hidden Divergences
Hidden divergences are the opposite of regular divergence.
As mentioned, regular divergences are indications of reversals.
But hidden divergences are indications of a continuation in trend.
So if you are looking to trade with the trend, then you want to use hidden divergences as a tool of confirmation that the price will continue to trend.
One of the common scenarios that many traders face is seeing the market trend for some time and want to get into the trade, but they fear the market is already overextended.
So they sit at the sidelines without taking a trade, only to see the market trend further.
And they say to themselves, “Dammit! I should have taken the trade!”
If you have experienced this before, then this is good news for you because hidden divergences can help you have more conviction to get into a trend trade.
Hidden Bullish Divergence
So let’s take a look at an example of a hidden bullish divergence on CADJPY:
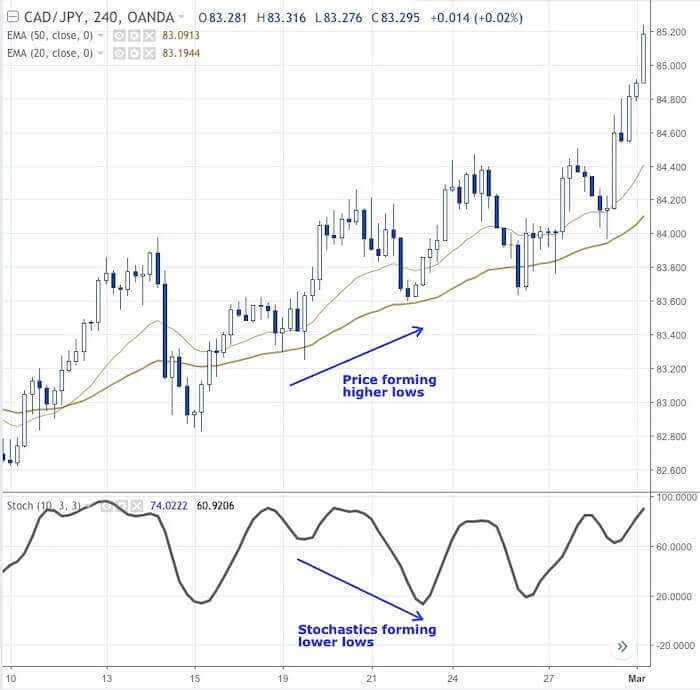
If you noticed in the chart above, price is making higher lows, but the stochastic indicator is making lower lows.
And that’s an indication that there’s a chance that prices will continue to go up.
So in a hidden bullish divergence, what you are looking for is for the price to be forming higher lows, while the stochastic indicator is making lower lows.
Hidden Bearish Divergence
In a hidden bearish divergence, what you want to look out for is for the price to be making lower highs, while the stochastic indicator is making higher highs.
Here’s an example of a hidden bearish divergence on EURUSD:

You can see on that on the right side of the chart, price is forming lower highs but the stochastic indicator is forming a higher high.
And this gives us a good indication that price will still continue to trend further down.
So if you’re already in a trade, it can give you conviction to hold on to your trade longer.
And if you’re not in a trade, it can be a good opportunity to get into a Short trade.
How to Enter Into A Divergence Trade
Now that you have spotted a divergence in the market, how do you enter into the trade?
You still have a number of considerations like:
- How will you decide the trigger to enter the trade? Will it be the break of the previous high/low? Will it be a certain candlestick pattern that is formed?
- Where are you going to place your Stop Loss?
- Where are you going to place your Take Profit?
- Do you have any rules in place to move your trade to breakeven?
- Do you have any rules in place to Take Profit early before your original Take Profit level is hit?
- What percentage of your capital are you going to risk on this trade?
- Is there any news coming out soon?
- What size will your trade be?
These are the things you need to have planned for even before you take the trade.
Entry Rules For Bullish Divergence
Here are my entry rules for getting in a bullish divergence trade:
For a bullish divergence trade (both regular and hidden), I will look to enter when price closes above the 20 EMA, or when a bullish candlestick formation is formed.
And I like to enter my trades on the nearest 5’s or 10’s of price.
So for example, if price closed above the 20 EMA and it’s at 1.2042, I will enter Long @ 1.2045.
I apply the same rule to my Stop Loss as well.
And the reason I do this is because it makes it easier for me to position size my trade.
So let’s take a look at an example of a trade I took:

So let me walk you through how the trade is entered:
Step 1: Identify the bullish divergence. In this case, it’s a hidden bullish divergence because the price is forming higher lows, but the stochastic indicator is forming lower lows.
Step 2: Wait for price to close above the 20 EMA. In this case, price closed above the 20 EMA @ 83.86.
Step 3: Place Stop Order to go Long at the nearest 5’s or 10’s. In this case, I chose the nearest 10’s and that is 83.90.
Step 4: Place Stop Loss that’s at least 10 pips away from the previous swing low. In this case, the previous low is 83.60. So I chose 83.50 as my Stop Loss.
Step 5: Place your Take Profit. I personally like to use 1.5 R because based on my testing, this is the most optimal place for getting the best returns based on the win-loss ratio I’m willing to accept.
Some traders I know like to take 2R or more. That’s fine and it’s 100% up to your testing for what works for you and your psychology.
But do understand that the further your Take Profit level is, the lower your probability of having the trade work out in your favour.
For example, if your Take Profit is at 1R, then the probability of your win could be 70%.
And if your Take Profit is at 2R, then the probability of your win could be slightly lower at around 50% – 60%.
Now, don’t mistake a higher probability as having higher profitability.
It’s possible that a trading system with just a win rate of 30% can be more profitable than a trading system with a win rate of 70%.
However, a trading system with a 30% win rate will have to go through longer streaks of losses than a 70% win rate trading system.
So it comes down to whether you are someone who can stomach a longer losing streak and eventually get a big winner after that.
Or you’re someone who prefers to have more consistent wins but has relatively smaller winners (1R – 1.5R).
Personally, I like to have a higher win rate and give up bigger wins to have a more stable and consistent equity curve.
So ultimately, it comes down to your preference.
But one thing is for certain – do not take any profits that are lesser than 1R.
That would be a clear path to losing in the long run.
Entry Rules For Bearish Divergence
Okay, now let’s look at a bearish divergence entry on EURCAD:

Let’s walk through how to place this trade:
Step 1: Identify the bearish divergence. In this case, price formed a double top while the stochastic indicator is clearly forming a lower high.
Step 2: Wait for price to close below the 20 EMA. In this case, price not only closed below the 20 EMA but also closed below the 50 EMA. It closed at 1.5066. Again we want to take our entry at the nearest 5’s or 10’s and in this case, I chose to go Short @ 1.5060.
Step 3: Place a Stop Order to go Short @ 1.5060.
Step 4: Place Stop Loss at least 10 pips away from the previous swing high. In this case, I chose to place my Stop Loss @ 1.5160
Step 5: Place Take Profit. In this case, I placed my Take Profit 1.5R away which is at 1.4910. You can see it hit my Take Profit level several days later.
Do Divergences Actually Work?
This question is like asking, “Can I make money if I start my own business?”
The answer is, “It depends”.
You see, it’s a fact that there are businesses that make money.
Amazon makes money.
Apple makes money.
But that doesn’t mean if you start a company like Amazon or Apple, you will make money.
It all comes down to the product you create, how you do your marketing, and you sell your brand, and how you get customers to buy from you over and over again.
And when it comes to trading divergences, it’s the same.
Divergences by itself don’t tell you whether you will make money or not.
It all comes down to your risk management, the parameters of your trade management like your Stop Loss and Take Profit, and the probability of your winning trades.
For example, two different traders can see the same chart and get into the same trade at the same price, but one of them can make a profit, while the other gets stopped out for a loss.
Take a look at this chart:

From this chart, you can see a clear bearish divergence has formed.
Price is making higher highs, but the stochastic indicator is making lower highs.
So according to our previous entry rules, both traders would enter a Short trade @ 1.4610:

However, Trader A is an aggressive trader.
He decides to place his Stop Loss above the previous candlestick’s high @ 1.4660, which is 50 pips away from his entry.
And since his Stop Loss is relatively tight, he decides to place his Take Profit @ 1.4460 looking to take a 3R profit on this trade.

Trader B isn’t as aggressive.
He places his Stop Loss at the previous swing high @ 1.4700, which is 90 pips away.
And since his Stop Loss isn’t very tight, he is only looking to take 1.5R out of this trade and places his Take Profit level 135 pips away @ 1.4475.

Let’s see what happens next…

As you can see in the chart above, Trader A got taken out of the market in the next bar while Trader B eventually hit his Take Profit.
Now, back to the question, “Does divergence work?”
Trader A, who got stopped out, might probably say that divergence doesn’t work.
Trader B, who is probably dancing to the bank now, will probably say that divergence is the Holy Grail!
So the answer to that question is simply this – “It works if you make it work for you”.
That means if you have the right trade management, the proper risk management, and you have tested those parameters across a substantial number of trades, then it will work for you.
With that said, I’ve taken the liberty to create for you a Divergence Cheat Sheet below with several chart examples to illustrate both bullish divergences and bearish divergences.
This way you can easily print it out and have it by the side of your computer as you trade the markets.
The more charts you see, the more easily you will be able to identify these divergences 🙂
Divergence Cheat Sheet (With Trade Examples)


Chart Examples
1) Regular Bullish Divergence (Indicates Trend Reversal)
You are looking for price in a downtrend that is forming lower lows, and looking for the stochastic indicator to form higher lows.
2) Regular Bearish Divergence (Indicates Trend Reversal)
You are looking for price in an uptrend that is forming higher highs, and looking for the stochastic indicator to form lower highs.
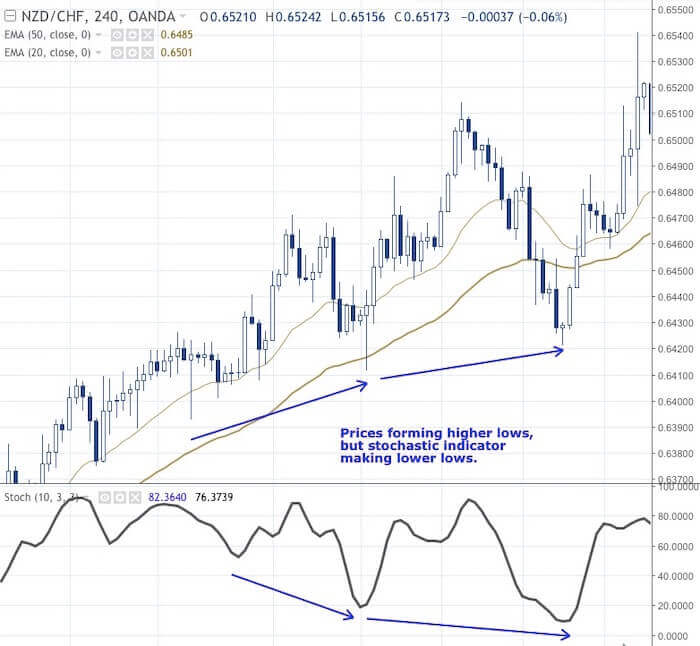
3) Hidden Bullish Divergence (Indicates Trend Continuation)
You are looking for price in an uptrend that is forming higher lows, and looking for the stochastic indicator to form lower lows.
4) Hidden Bearish Divergence (Indicates Trend Continuation)
You are looking for price in a downtrend that is forming lower highs, and looking for the stochastic indicator to form higher highs.

Conclusion
Trading divergences can be very profitable if you have the right trade management and you have proper risk management.
It’s one of my bread and butter trading strategies and it should be yours as well.
One final thing…
Did you like this post?
If you liked this post or felt it was helpful for you, would you please share it?
I’d really appreciate it if you do because I’ve put in lots of effort to make sure that you know exactly how to trade the Forex market with an edge.
Remember, sharing is caring, and it won’t even take 5 seconds of your time.
So go ahead, click the share button below now to help more traders get an Edge trading the Forex market 🙂
Leave a Reply