
One of the most effective ways to identify a turning point in the market is with divergence.
Divergence can help you identify when the market might continue in its trend after a pullback…
And divergence can help you identify when there might be a reversal in trend.
The way to identify divergence in the market is with the use of indicators.
And the RSI Divergence Indicator is one such indicator.
In fact, it’s one of the most popular and widely used indicators.
However, most traders do not use it to identify divergence in the market.
Instead, they use it to find overbought and oversold conditions in the market.
And the reason is that most traders don’t really know how to use the RSI to identify divergences.
And those who do, use it the wrong way.
So how do you identify a divergence using the RSI indicator?
And more importantly, how do you trade divergence once you’ve identified it on the RSI indicator?
In this ultimate guide, I will share will you everything you need to know about divergence…
I’ll also share with you how to use the RSI indicator to identify divergence correctly and accurately…
And I’ll also share with you exactly how to trade it.
Let’s dive right in.
What Exactly is RSI
The Relative Strength Index (RSI) is a momentum indicator that measures the change in price to identify overbought or oversold conditions in the market.
It has a range of 0 to 100.
If the RSI has a reading below 30, the market is considered oversold.
And if the RSI has a reading above 70, the market is considered overbought.

The most common way that traders trade the RSI is by identifying overbought and oversold conditions in the market.
For example, if the market is overbought, traders would Short the market.
And if the market is oversold, traders would Long the market.

You can see in the chart above that when the RSI has a reading below 30, the market went up.
And when the market has a reading at 70, the market subsequently went down.
However, this way of trading is only effective if the market isn’t trending.
If the market is in a strong downtrend, and you kept buying every time the RSI shows an oversold reading…
Then your trading account will get wiped out very quickly.
Similarly, if the market is in a strong uptrend, you don’t want to be going Short each time the RSI shows an overbought reading.
So instead of using the RSI indicator to trade overbought and oversold conditions in the market…
A better way to use it is to trade divergence.
What Exactly is Divergence?
So in order to trade divergence in the market, you first need to know what is divergence.
Divergence is simply when the market is moving in an opposite fashion to the indicator.
More specifically, the “waves” formed by the market and the indicators differ.
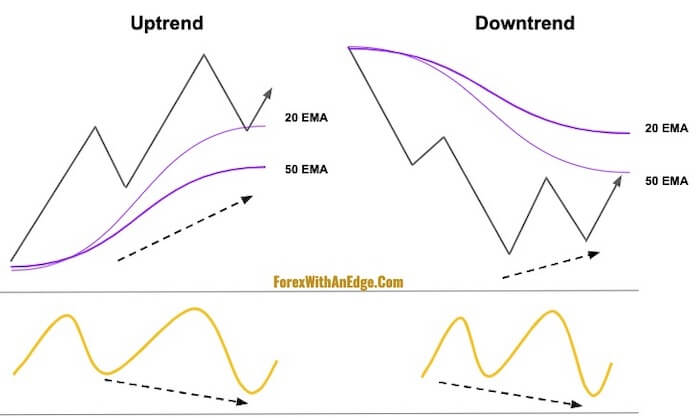
You see, when the market is in an uptrend, it forms a wave pattern of higher highs and higher lows like this:

And when the market is in a downtrend, it forms a wave pattern of lower lows and lower highs like this:

The RSI Divergence Indicator will also make wave patterns that mimic the wave patterns of the market like this:

Do you see how the RSI mimics the movement of the market very closely?
So a divergence occurs when the wave patterns of the RSI forms differently than the market’s wave patterns.
How to Identify Divergence with RSI
First of all, to trade divergence using the RSI indicator, I like to remove the overbought and oversold lines so that I can see the RSI lines better.
And if you’re like me, then you’d want to remove those lines as well.
I use TradingView as my charting software, so all I have to do is simply uncheck it in the settings box:

If you’re using the MT4 platform, you can also easily remove both lines.
Next, what you need to know is that there are two types of divergences:
- Bullish Divergence
- Bearish Divergence
A bullish divergence occurs when the RSI indicator is indicating that the market might be starting to go up.
A bearish divergence occurs when the RSI indicator is indicating that the market might be starting to go down.
Bullish Divergence with RSI
There are two types of divergences you can identify in a bullish divergence:
- Regular Divergence
- Hidden Divergence
For a bullish regular divergence, we are looking for the market to form a lower low or a double bottom, but the RSI indicator to form a higher low.
Here’s a diagram to show you what you want to look out for on the charts:

In both diagrams, I’ve added two Exponential Moving Averages – the 20 EMA and the 50 EMA.
This will give you a quick way to identify whether the market is in an uptrend or a downtrend.
You can see that the regular divergence can happen in both an uptrend and a downtrend.
For a bullish hidden divergence, we are looking for the market to form a higher low but the RSI indicator to form a lower low.
Here’s a diagram to show you what you want to look for on the charts:
Similarly, you can see that the hidden divergence can be formed in both an uptrend and a downtrend.
While they can appear in both an uptrend and downtrend, the diagram you see in the downtrend occurs less frequently.
But when it does appear, it can be a very high probability trade.
So it’s important that you’re able to identify it when it does appear on your charts.
Bearish Divergence with RSI
Similarly, for bearish divergence, there are two types of divergence:
- Regular Divergence
- Hidden Divergence
For a bearish regular divergence, we are looking for the market to form a higher high or a double top, but for the RSI indicator to form a lower high.

And for a bearish hidden divergence, we are looking for the market to form a lower high, but for the RSI indicator to form a higher high.

As you can see for both types of bearish divergences, it can happen in an uptrend and a downtrend as well.
And again, the hidden divergence that happens on an uptrend appears less frequently than in a downtrend.
So it’s important to really digest the diagrams above so you don’t get confused when you start looking at your charts.
Now, that you know what to look out for on the charts, let’s get into the details on how to trade it.
How to Trade With the RSI Divergence Indicator
To trade the divergence with the RSI, I’ve split the trading setups into two types:
- Bullish Divergence Setups
- Bearish Divergence Setups
We only go Long in a bullish divergence setup, and only go Short in a bearish divergence setup.
Bullish Divergence Setups
There are two types of bullish divergence setups:
- Pullbacks to go Long
- Reversal Patterns to go Long (Double Bottoms & Lower Lows)
Pullbacks are trend continuation setups.
We are looking to get into a trade then the market does a pullback and there is divergence.
Reversal patterns are countertrend trading setups.
We are looking to get into a trade when the market form either a double bottom or a lower low.
Then we look to the RSI to see if there’s divergence.
If there is, we look to go Long.
Pullbacks to Go Long
To go Long for the pullback trade, we are only looking for the trade when the 20 EMA is above the 50 EMA.
Here are the entry rules:
Step 1: Look for the 20 EMA to just cross above the 50 EMA.
Step 2: Wait for the market to do a pullback to either of the EMAs.
Step 3: Look for either a hidden divergence on a higher low, or a regular divergence on a double bottom / lower low.
Step 4: If there is divergence, wait for the market to close above the 20 EMA. That is our signal to go Long.
Step 5: Either go Long at the close above the 20 EMA, or wait for the market to come down a little before going Long.
Step 6: Place Stop Loss below the swing low.
Step 7: Place Take Profit either at 1.5R, 2R or use a Trailing Stop Loss.
Let’s take a look at an example.

In the chart above, you can see that the market is in a clear uptrend.
The 20 EMA is above the 50 EMA and the market has been trading above the 20 EMA.
The market then did a pullback to the 20 EMA and closed below it.
Then in the next bar, it closed above the 20 EMA with a Bullish Engulfing Pattern.
That is our trigger to go Long.
You can either go Long at the close of the Bullish Engulfing Pattern candlestick, or place a Buy Limit Order below it.
If you had gone Long at the close, you would now be in a profit.
If you had waited for the market to come down a little before going Long, then you would have missed this trade.
I typically like to wait for the market to come down a little so I can have a better entry.
And if I miss my trades, so be it.
I know there are many more trades to come.
So missing just one trade won’t affect me at all.
That’s the mentality you want to have as well when trading the markets.
Be disciplined and stick to your rules.
Reversal Patterns to Go Long
To go Long for a reversal pattern trade, we are only looking for the trade when the 20 EMA is below the 50 EMA.
Here are the entry rules:
Step 1: Look for the 20 EMA to just cross below the 50 EMA.
Step 2: Wait for the market to form a double bottom or lower low.
Step 3: Look for either the RSI indicator to form a higher low.
Step 4: If there is divergence, wait for the market to close above the 20 EMA. That is our signal to go Long.
Step 5: Either go Long at the close above the 20 EMA, or wait for the market to come down a little before going Long.
Step 6: Place Stop Loss below the swing low.
Step 7: Place Take Profit either at 1.5R, 2R or use a Trailing Stop Loss.
Let’s take a look at an example.

The trade example above is on the AUDUSD 1-hour timeframe.
You can see that the market is in a downtrend.
The 20 EMA is below the 50 EMA and the market is trading well below the 20 EMA.
Then it formed a very distinct double bottom.
At the same time, the RSI indicator is showing a higher low for a divergence.
When the market finally closes above the 20 EMA, that is our trigger to go Long.
Again, you can go Long at the close above the 20 EMA, or place a Buy Limit Order below it to get a better entry.
As you can see, the market started to go up right after that.
Bearish Divergence Setups
Similarly for bearish divergence, there are two setups:
- Pullbacks to go Short
- Reversal Patterns to go Short (Double Tops & Higher Highs)
For a pullback to go Short, we are looking for the market to be in a downtrend and form a lower high but the RSI indicator to form a higher high.
For a reversal pattern to go Short, we are looking to get into a trade when the market forms either a double top or a higher high, but the RSI indicator to form a lower high.
Pullbacks to Go Short
To go Short for the pullback trade, we are only looking for the trade when the 20 EMA is below the 50 EMA.
Here are the entry rules:
Step 1: Look for the 20 EMA to just cross below the 50 EMA.
Step 2: Wait for the market to do a pullback to either of the EMAs.
Step 3: Look for either a hidden divergence on a lower high, or a regular divergence on a double top / higher high.
Step 4: If there is divergence, wait for the market to close below the 20 EMA. That is our signal to go Short.
Step 5: Either go Short at the close below the 20 EMA, or wait for the market to go up a little before going Short.
Step 6: Place Stop Loss above the swing high.
Step 7: Place Take Profit either at 1.5R, 2R or use a Trailing Stop Loss.
Let’s take a look at an example.

The above is a trade example on the EURUSD 1-hour timeframe.
You can see that from the left-hand side of the chart, the market has been in a downtrend.
The 20 EMA is below the 50 EMA and the market is trading below the 20 EMA.
The market then did a pullback to above both EMAs and formed a double top.
At this point, the RSI indicator is showing a lower high.
This indicates a divergence.
Once the market closes below the 20 EMA, we either go Short at the close or place a Sell Limit Order above it.
Whenever a double top forms in a downtrend with a divergence, I consider it a high probability trade setup.
That’s because the double top by itself is a bearish reversal pattern.
While its commonly found in an uptrend, it’s can also appear in a downtrend but is much rarer.
So when it forms in a downtrend and is coupled with a divergence, it’s a strong indication that the market will continue to go lower.
And as you can see, the market went much further down after that.
Reversal Patterns to Go Short
To go Short for a reversal pattern trade, we are only looking for the trade when the 20 EMA is above the 50 EMA.
Here are the entry rules:
Step 1: Look for the 20 EMA to just cross above the 50 EMA.
Step 2: Wait for the market to form a double top or higher high.
Step 3: Look for either the RSI indicator to form a lower high.
Step 4: If there is divergence, wait for the market to close below the 20 EMA. That is our signal to go Short.
Step 5: Either go Short at the close below the 20 EMA, or place a Sell Limit Order above it and wait for the market to go up a little before going Short.
Step 6: Place Stop Loss above the swing high.
Step 7: Place Take Profit either at 1.5R, 2R or use a Trailing Stop Loss.
Let’s take a look at an example.

The trade example above is on the EURUSD 1-hour timeframe.
From the left-hand side of the chart, you can see that the market is in an uptrend.
The 20 EMA is above the 50 EMA and the market has bounced off both EMAs a couple of times.
At the last bounce off the 20 EMA, the market formed a higher high.
At the same time the RSI indicator is showing a lower high for a divergence.
The market then started to go down and closed below the 20 EMA.
At this point, either go Short at the close of the long bearish candlestick bar…
Or place a Sell Limit Order above it to get a better entry.
In this case, the market did go up almost 10 pips before coming down again.
After that, the market started going down.
Conclusion
While the RSI indicator is more commonly used by traders to identify overbought and oversold conditions in the market…
Using it to trade divergence would be a better option.
In this guide, I’ve shared with you everything you need to know to trade divergence using the RSI indicator.
All that’s left for you to do now is to go through the diagrams and the examples again…
And then open up your chart to see if you can spot it.
Now I’ve got a question for you:
Tell me – do you use the RSI indicator to trade divergence?
Let me know in the comments below.
One more thing…
Did you like this post?
If so, would you please share it?
Remember, sharing is caring, and it won’t even take 5 seconds of your time.
So go ahead, click the share button below now 
Leave a Reply