
Want a “no-loss” trading strategy?
Then most likely you’re thinking of grid trading.
Many people get lured to grid trading because of how simple it is to trade and profit from the market.
There’s no need to guess where the market is going…
There’s no need for technical analysis or seeing chart patterns…
And there’s no need for recognizing candlestick patterns or having any indicators.
All you have to do is just buy and sell at fixed intervals, and then don’t place a Stop Loss right?
Not really.
Unless you have unlimited funds, doing that will wipe out your account faster than you can say “grid trading”.
So can grid trading really work?
Can it be profitable?
In this post, I’m going to break down exactly what grid trading is…
The wrong way to do it…
And the right and safe way to do it.
What is Grid Trading
So what exactly is grid trading?
It’s simply dividing the market into many levels and placing buy and sell orders at each level.

The chart above is of the USDJPY.
As you can see, I’ve divided the chart into 100-pip interval levels.
That means each level is 100 pips from each other.
So what grid traders would typically do is buy and sell at each level, and then take profit at every other interval.
On the left-hand side of the chart, you can see that USDJPY is trading at 114.00.
So what grid traders would do is go Long and Short at the same time at 114.00.
Then as the market goes down to 113.00, they would take profit on their Short position at 114.00 for a 100-pips profit…
And they will hold on to their Long position at 114.00.
Then they will go Long and Short again at 113.00.
So at this point, they will have these current positions:
- Long at 114.00
- Long at 113.00
- Short at 113.00
When the market goes back up to 114.00, they sell off their Long position at 113.00 for a 100-pip gain…
And then go Long and Short again at 114.00.
So at this point, their current positions are:
- Long at 114.00
- Short at 114.00
What has happened here is that they are now back at their starting position.
The only difference is that they have now taken two 100-pip profit already.
Then as the market goes down to 105.00, as you can see on the chart, they will collect all the Long positions and would have taken profit on their Short positions on the way down.
So at 105.00, they would have these positions:
- Long at 114.00
- Long at 113.00
- Long at 112.00
- Long at 111.00
- Long at 110.00
- Long at 109.00
- Long at 108.00
- Long at 107.00
- Long at 106.00
- Long at 105.00
- Short at 105.00
Then as the market goes up, they unload their Long positions one by one and build up their Short positions.
This is what a typical grid trading strategy does.
However, this is a very dangerous strategy.
Here’s why.
With this type of grid trading strategy, there’s usually no Stop Loss in place.
And because there is no Stop Loss, grid traders don’t expect to take a loss.
For example, they have calculated their risk where their account would only wipe out if the market goes against them for X number of levels.
Let’s use 20 levels as an example.
Many grid traders have this false belief that the market can’t go against their positions 20 levels in a row without going up at least one level.
So what they do is double their position as the market goes against them.
This is called a martingale strategy.
And all that’s needed is for the market to just go in their direction by one level and they would be able to take profit.
But according to Murphy’s Law, anything that can go wrong will go wrong.
And that’s why most traders that use a grid trading strategy inevitably go bust.
That’s because they are doing it the wrong way.
Why Grid Trading?
The main reason why many people get lured into grid trading is that it’s coined as a “no-loss” strategy.
You simply place your orders at every level, and when it hits a Take Profit level, you make money.
The only time you lose is when you run out of money to hold your losing positions as the market goes against you.
In a sense, it’s like an all-or-nothing trading strategy.
And I wouldn’t even exactly call it a “trading strategy”…
It’s more like gambling.
Many traders would program such grid trading strategies into what’s called an Expert Advisor (EA).
This is an algorithm to automatically trade the markets on the MT4 platform.
So what traders will do is to backtest this type of strategy and just curve fit it to the historical data.
This will result in their backtest showing zero losses.
And with that, they think they have found the “holy grail” trading strategy.
But almost inevitably, traders who trade this way will have their accounts wiped out when trading live.
How do I know?
I used to be one of these traders in the past.
Back in 2010, I had extensively researched and backtested such types of grid trading strategies and many of them looked great when backtested.
The graph would show a consistent uphill slope in profits.
But when I trade it live, some of it will last a year before one big move in the market wipes out the account…
And some of it lasts just only a few months.
The Dangers of Grid Trading
The trading strategy which I just shared with you above is a very dangerous trading strategy that will inevitably make your trading account go bust.
For example, if the market keeps going in one direction and you’re just averaging into your positions, there will come a point where you run out of money.
And that’s where you will lose all the profits that you made and more.
Also, many traders are attracted to grid trading because you can take quick profits.
So when trading such a strategy, traders focus only on how much they can make.
Instead of identifying what their worst-case scenario is, they focus on how much money can be made at each Take Profit level.
Here’s an example…
Let’s say you decided to build a 10-pip interval grid trading strategy, and have alotted a capital of $1,000 to trade it.
For this strategy, you have decided that you will go both Long and Short at each level.
Instead of calculating where is your cut-off point based on how much capital you have, you focus on how much you can make at each 10-pip Take Profit.
So the way you decide this is by a fixed dollar amount.
You have decided that every time you take a profit, you want to make $10.
That means each 10-pip Take Profit level will make you $10.
So if you just hit your Take Profit levels ten times a day, you will make $100.
For that to happen, you calculate your position size to be 1 Mini Lot (0.10 Lot).
At the end of five trading days, you realized that each day you had made $100.
Everything looks fantastic and promising.
At this point, your total trading capital is now $1500.
You just made 50% on your capital in 5 days and you’re thinking trading is easy.
Then on the sixth trading day, the market started trending strongly in one direction and the market never came back.
It just kept going in one direction until you have no more money to fund new levels and your open loss from your positions has wiped out your trading account.
This is why grid trading is very dangerous.
That’s because traders do not calculate their maximum risk.
They only think about how much they can make.
What’s worse is that aggressive grid traders will use a martingale strategy.
That means that as the market goes against their positions, they will increase their position as it goes against them.
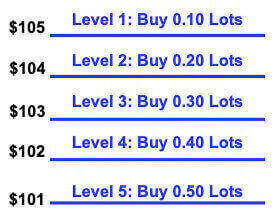 The diagram above shows a very simple grid where you increase your size as the market drops.
This can be very dangerous if you don’t know exactly what your drawdown will be at each level.
Most traders using a grid trading strategy have no idea about this at all.
So they don’t know exactly at which level they will run out of capital.
If you want to do grid trading, then you must know exactly what is your risk at each level…
And you must also know exactly where is the maximum cut-off point before your account goes to zero.
How to Build A Safe Grid Trading Strategy
So now that we know the dangers of grid trading, the question is:
Is it possible to build a safe grid trading strategy that ensures no loss and will stand the test of time regardless of how big a move the market makes?
The answer is yes.
But for that to happen, there are a few criteria:
- This will be a Long-only grid trading strategy.
- It has to be in a market that has a very slim chance of going to zero.
- There must be no finance charges or negative interest for holding the positions daily.
- You must have the funds to hold all your positions to zero.
With these criteria, what we have is a solid grid trading strategy that will stand the test of time and not lose money…
Except when the instrument goes to zero of course.
But with a good instrument selection, that will not be a factor.
Now, the reason we want this to be a Long-only strategy is so we will know where the absolute cut-off point is…
And we can calculate our exact risk when it gets to zero.
With Short positions, there is no limit to how high the market can go, so there’s no way for us to know where the cut-off point is.
So the key to making this grid trading strategy work is your risk management.
In trading, risk management is very important.
In grid trading, risk management is everything.
Because if you miscalculate your risk, your account can get easily wiped out.
But if you manage your risk properly, then the profits will take care of itself.
So here’s how the strategy looks like from a 30,000-foot view:

The diagram above is a very simplistic view of the grid trading strategy.
The idea is to simply buy as the market drops and then take profit whenever it goes up.
So there are a few important elements to decide when building this grid trading strategy:
- The number of levels
- Trade Size of each level
- Distance between each level
- Take Profit strategy
The Number of Levels
How many levels do you plan to have?
The more levels there are, the more frequent the trades.
The more frequent the trades, the more often you can get to take profit.
But there’s a trade-off.
The trade-off is that if you want to maintain the same maximum nominal risk for the entire grid, then each level will have a smaller position size.
For example, a grid of 10 levels may have a position size of 0.10 Lots at each level.
But a grid of 20 levels will need to have a smaller position size for each level to maintain the maximum risk of the whole grid structure.
This way, if the market goes to zero, both grid structures would lose the same amount.
If you want to maintain the same size for each level regardless of how many levels there are, then your maximum loss will be increased with more levels.
So this is a trade-off that you want to balance with more levels.
Trade Size of Each Level
What is the position size of each level?
Will it be evenly distributed across all levels?
Or will it be bottom-heavy where the size is increased as the market drops?
There are many ways to structure the position size of your grid levels.
In general, there are two types of position sizing strategies:
- Anti-Martingale
- Martingale
Anti-martingale is when you take either a fixed percentage or fixed lot size per trade.
So if your capital is $10,000, you might want to risk 2 percent of your capital on each trade, or a fixed lot size of 0.10 per trade.
But with a martingale position sizing strategy, you will be increasing your size as the market goes against you.
Normally, using a martingale position sizing strategy is very dangerous.
However, there’s only one scenario where a martingale strategy can be safe and profitable in the long run…
And that is with this strategy I’m sharing with you here.
That’s because the only way you can lose your money is if the market goes to zero.
As long as it doesn’t, you can keep increasing your position as the market drops.
And hence it’s important to choose the right instrument to trade this strategy.
But of course, you MUST also know what is your maximum risk in the event the market goes to zero.
This way you do have sufficient capital to hold the whole grid structure at all times.
Distance Between Each Level
How far away is it from each level?
If you’re trading it in the Forex Market, is it every 250 pips, 100 pips, 50 pips?
This has to be balanced with the number of levels you have for your grid.
If you have more levels, then you can have a smaller distance between each level.
But if you have lesser levels, then you will have a bigger distance between each level.
Take Profit Strategy
How will you take profit?
Will you take profit at each one-level interval?
Or will it be many levels?
Or will you take profit at fixed price levels?
There are many variations you can have for taking profit with the grid strategy.
With these four elements, you’d be able to build your grid trading strategy.
Putting It All Together
So here’s a simple grid trading strategy that I got inspired to build when reading the book The Profitable Art And Science of Vibratrading by Mark Andrew Lim.
In his book, he describes a grid trading strategy that works as a long-term strategy and will not lose money unless the market goes to zero.
So I’ve put together a grid trading strategy with 3 different risk levels.
There are a few important things you need to know about this grid trading strategy:
- This is a Long-only strategy.
- It is a long-term strategy.
- I chose USDJPY because of its positive swap. Each day we hold the position we will get paid a positive swap.
- Since 2003, the lowest USDJPY has ever traded at is $76.00 which was in 2011. So the lowest level we will go Long at is $70.00. This gives us a buffer of $6.00 below the historical low. In the event it goes below $70.00, we will no longer add any positions and just hold the trade till it comes back or go to zero.
Here are the details of each grid structure…
Grid Structure #1
Maximum Risk: $35,800
Instrument: USDJPY
No. of Levels: 40
Level Distance: 100 pips
Position Sizing: Fixed 0.01 Lot per level

So what I’ve done is come up with a spreadsheet to show you exactly how the strategy works.
First of all, what you want to see in this spreadsheet is the maximum risk of this grid structure.
You can see that the total risk is the sum of all the individual level’s risk when it goes to zero.
For example, level 1 at $109.00 with a lot size of 0.01 (1 micro lot) has a total risk of $1,090 when it reaches zero.
So when all the levels combined, the total risk is $35,800.
This is the absolute loss that this grid structure will incur.
You can’t lose more than this.
So you will need $35,800 to trade this grid structure to its maximum efficiency.
Next, you want to take a look at the “Drawdown” column.
That tells you exactly how much your open loss will be when the market gets to that level.
So if the market drops to level 20, you will know that your drawdown would be $1,900.
Why is this important?
Because with this strategy, there is no need to put the entire $35,800 capital at the beginning.
We only add more capital to your trading account as the market drops lower.
And the reason we do that is that we want to maximize our money.
If you put the whole $35,800 in at the start, a big part of it won’t be utilized if the market doesn’t even get to the lower levels.
So the money management strategy is to fund just enough for 10 levels at a time.
That means at the start, you only need to fund $450 to your trading account for the first 10 levels.
When the market drops to level 5, you fund your account for another 5 levels.
And that means to top up another $600 to have a total capital of $1050.
And as you get filled every 5 levels, you fund your account according to the drawdown for the next 5 levels.
With the rest of the unused capital up to $35,800, you can put it in a high-yield savings account, or any short-term capital guaranteed investment.
This way, when you need that money to fund the grid, you can easily withdraw it again.
Using this method, you can utilize your money properly and still grow the unused portion of your capital that you’ve set aside for this grid trading strategy, rather than let it sit idle in your trading account.
The next part you want to take note of in the spreadsheet is the “Profit” column.
So what I’ve done for this strategy is for it to take profit at fixed price intervals.
For example, the first 5 levels of $109.00 to $105.00 will all take profit at $110.00.
So when level 1 hits the Take Profit level at $110.00, it will make $10.
When level 2 hits the Take Profit level at $110.00, it will make $20.
When all 5 levels take profit, it will give a total combined profit of $150.00.
Levels 6 – 10 will all take profit at $105.00.
Levels 11 – 15 will all take profit at $100.00.
And so on.
On top of these, this strategy also profits every day from a positive swap on the USDJPY.
Let’s take a look at it visually on the USDJPY chart so you can see how it works:

The blue lines represent the buy levels at every 100-pips interval, and the green lines represent where the Take Profit levels are as shown in the spreadsheet.
As you can see, the market did a nice big take profit at 110.00 in January 2020.
Now, if you noticed in my spreadsheet, I only prepared the grid structure up to 110.00.
What if the market goes above 110.00?
Then you would have to restructure the grid again and that would mean an increase in the maximum risk…
Or an increase in the pip-interval for each level to maintain the same maximum risk.
With that said, over the long-term, this grid trading strategy will bring in guaranteed profits.
There’s a very slim chance that you will lose all your money because when was the last time USDJPY went to zero?
So while this grid trading strategy is profitable, there is a drawback to this strategy…
And that is don’t expect to double or triple your trading account because the profit is very minimal.
If you noticed on the charts, it took about 5 months to have the first 5 levels take profit at 110.00.
That means $150 in 5 months.
But you did only fund your account for the first 10 levels for $450.
So considering that, it’s not bad.
However, you can’t increase your size because that would increase the overall risk of the grid.
So that’s a big drawback.
Now, let’s take a look at two more grid structures with lesser capital needed.
Grid Structure #2
Maximum Risk: $17,800
Instrument: USDJPY
No. of Levels: 20
Level Distance: 200 pips
Position Sizing: Fixed 0.01 Lot per level

For this grid structure, the maximum risk is lower at $17,800.
But it’s still a hefty amount for many people.
However, chances are you won’t need to utilize all your capital.
Because if USDJPY doesn’t go below it’s historical low at 76.00, then chances are that you will probably only need to utilize $3,800 to cover a drawdown all the way to 70.00.
Grid Structure #3
Maximum Risk: $8,250
Instrument: USDJPY
No. of Levels: 10
Level Distance: 500 pips
Position Sizing: Fixed 0.01 Lot per level

For this grid structure, the maximum loss is only $8,250 and there are only 10 levels.
So while the maximum risk is much smaller for this grid structure, the downside is that you will hardly get many trades because the intervals are 500 pips for each level.
That is a very wide distance for each level, and you’d probably need to adjust your take profit levels to every 500 pips.
So as you can see, there is a trade-off for lower risk.
Conclusion
By now, you should understand that grid trading isn’t exactly what many people deem it to be.
If you want a grid trading strategy that can double or triple your trading account quickly…
Then you have to be prepared for the eventuality that Murphy’s Law will kick in and wipe your trading account out.
But if you don’t mind a slow and steady grid trading strategy that is guaranteed to be profitable in the long run…
Then what I’ve shared with you in this post will do just that.
Now, I’d like to hear from you…
Do you use a grid trading strategy to trade the markets?
Let me know in the comments below.
One more thing…
Did you like this post?
If so, would you please share it?
Remember, sharing is caring, and it won’t even take 5 seconds of your time.
So go ahead, click the share button below now 
Hey Davis,
I really need your professional advise. I was trading the squeeze strategy for 2 weeks and it worked brilliant. Somehow, from one day to another, it stopped working. Since last Thursday literally every trade hit my stop loss, which is two times the ATR (I’m trading on a 15 minute chart). I really need your advise what to do next. Should I go on or is the strategy not valid anymore? Or maybe doesn’t it work consistently for trading forex on the M15? Maybe my exit strategy is not the right one, I always wait for minimum one time the ATR.
I’d love to get an advise from you, maybe you would recommend me antoher strategy for the 15 min timeframe in the forex market, or maybe you see a mistake in my rules? Thanks in advance, I’m really waiting for your answer.
Best regards,
Daniel
Quite strange that I saw this article two times, the first before getting “rekt” I didn’t fully understand. Now, after being rekt on a suicide grid strategy, every dot or comma of yours makes sense to me (lol). I like your trading ideas. God bless you for sharing your acquired knowledge, it was really meaningful for me