
Picture this scenario…
You’re looking at your charts and you see the market has reached a key resistance leave and is starting to stall…
You know that at this point, there could be a possible Short trade setup.
And you’re getting excited…
You start to think of all the things you can buy from the money you have yet to make…
And all you need to make this happen is to look out for a bearish candlestick pattern to form.
That would be your signal to go Short.
But then, you suddenly realize there’s a problem…
You realized that you don’t remember all the different bearish candlestick patterns you’re supposed to be looking for!
You start panicking now while frantically looking for your notebook that you have written all your candlestick patterns on.
But you can’t find it.
The candlesticks are now forming one by one.
You second guess yourself as to whether the candlestick is a valid pattern for an entry.
And before you know it, the market starts dropping.
All you can do is watch it go down further and further.
And you say to yourself:
“Dammit! I should have memorized the one thousand and one candlestick patterns!”
You close your laptop, go into your room, and start feeling depressed for the rest of the day.
Okay…
I agree that’s a little bit extreme.
And that scenario I just described probably never happens…
At least it should never happen.
But what does happen is that traders do miss their trades because they get confused by the tons of different candlestick patterns the should be looking out for.
They get bogged down by wondering whether a certain candlestick is considered an entry or not.
And because there are just so many candlestick patterns out there, traders get caught in analysis-paralysis and miss good opportunities.
Now, if you feel this way, then I’ve got good news for you…
Because you can forget about every other species of candlestick patterns that have ever been discovered in this world…
And all you need is to recognize just 3 distinct bearish candlestick patterns to get into a Short trade.
In this post, I’m going to share with you…
- The only 3 bearish candlestick patterns that you need to know to get into a Short trade.
- The significance behind those patterns and why they have a high probability of working out.
- My trade setups for getting into a Short trade.
- Trade examples using these trade setups.
Excited already?
Let’s get started.
1) The Bearish Pin Bar
This is a one-bar formation and is the number one bearish candlestick pattern that I like to look for when I’m looking to take a Short trade.
It’s one of the most easily identifiable ones among the other candlesticks because it literally “sticks out”.
So here’s everything you need to know about this candlestick pattern.
What Is The Bearish Pin Bar

(Note: Don’t be confused by the color of the candlestick’s body because you can change it to whatever color you like it to be on your charting platform. In my images, yellow means a bullish bar and dark blue means a bearish bar.)
The Bearish Pin Bar is a candlestick where the head is located towards the bottom half of the entire bar.
Some people consider this the “inverted hammer” candlestick.
And it is…
However, the Bearish Pin Bar encompasses more than just the inverted hammer as I’ll show you below.
But what you need to know is that this is a powerful bearish candlestick pattern because of the psychology behind its formation.
If you noticed, the open and close is below the halfway mark of the candlestick.
This gives us a story as to what happened in this one candlestick.
The significance of this is that the bulls did try to push the market upwards.
However, the bears came back stronger as it pushed the market back down and closed pass the halfway mark of the candlestick.
This indicates that the selling pressure is much stronger than the buying pressure.
Just from this candlestick alone, we can have a sentiment that the tide might be changing and that the market might be reversing.
And the longer the wick (or the “tail”) of the bearish pin bar, the stronger the selling pressure.
But of course, we do not enter a trade simply off a Bearish Pin Bar.
We want to know whether it was formed because of some resistance level, chart pattern, or is it an isolated formation.
Different Species of Bearish Pin Bars
Like bears, there are also several different “species” of Bearish Pin Bars.
And it’s important to recognize it when it is formed so you know whether or not it’s a valid trigger to go Short.
Here are a few different formations of the Bearish Pin Bar:

While there are slight differences in each of their formation, they all have two things in common:
- They all open and close below the halfway mark of the whole length of the candlestick.
- The wick at the top is always longer than the body.
As long as these two things are present in the candlestick, it can be considered a bearish pin bar.
2) The Bearish Engulfing Pattern
This is a two-bar formation and I consider this candlestick pattern to be the strongest indicator that the bears have taken over.
What Is The Bearish Engulfing Pattern

The Bearish Engulfing Pattern is a candlestick that literally overshadows the previous candlestick.
There are 3 important traits to help you quickly identify this candlestick pattern:
- Its length is longer than the previous candlestick. But the high does not necessarily have to be higher than the previous candle’s high.
- It has a long body bearish body.
- The close is below the previous candle’s open.
These are the three distinct traits to help you identify this candlestick pattern.
It’s like David and Goliath standing side by side.

Because it’s much bigger than the previous candle, hence the name “engulfing”.
Now, we all know that David won the battle against Goliath…
But when the Bearish Engulfing Pattern forms, you definitely do not want to enter into a Long trade on this bugger.
You’d be eaten alive.
And here’s something interesting to note…
Some times when you combine the “David and Goliath” candlesticks together, it actually forms a bearish pin bar:

And if you zoom out to a higher time-frame, it might actually show up as a Bearish Pin Bar.
For example, if you notice these two candlesticks on the 30-min chart, it might show as a Bearish Pin Bar on the 1-hour chart.
Of course, this doesn’t happen all the time.
But when it does, I would have more conviction to go Short given the right setup.
3) The Dark Cloud Cover
The Dark Cloud Cover is also a two-bar formation.
It’s very similar to the previous two candlestick patterns, except that it may be slightly harder to recognize because of the required technicality of the formation.
For example, the Bearish Pin Bar is easily recognizable with a long tail upwards and a small body at the lower half of the candlestick.
The Bearish Engulfing Pattern is also easily recognizable because the second candle overshadows the first candlestick and has a big bearish body.
But the Dark Cloud Cover may need some discernment.
What Is The Dark Cloud Cover
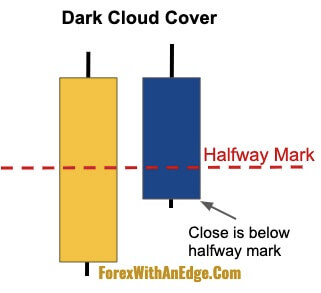
Technicality-wise, the Dark Cloud Cover is a bearish candlestick pattern where the second candlestick’s close has to be below the halfway mark of the first candlestick.
So just by that definition, the first candlestick is always longer than the second candlestick.
Here are the 3 distinct features it has to help you quickly recognize the Dark Cloud Cover:
- A bearish body that makes up the majority of the candlestick.
- Shorter in length compared to the previous candlestick.
- The close is below the halfway mark of the previous candlestick.
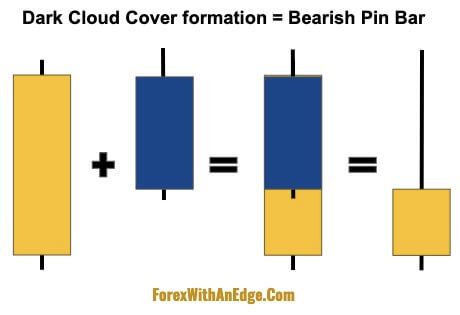
Here’s another interesting thing to note about the Dark Cloud Cover…
When you combine the two candlesticks, it always becomes a Bearish Pin Bar.
Okay, now that we know the 3 bearish candlestick patterns to look out for when going Short, let’s get into the trade setups.
Trade Setups
To get into a Short trade, some traders like to wait for the price to break the low of the bearish candlestick patterns to go Short.
I prefer to wait for a close below the low.
While I may not get as good of an entry compared to entering at the break of the low, this way I get lesser “fake outs”.
And if the candlestick that closes below the low of the bar is a rather long bar, I’d set a Limit Order to go Short at the halfway mark of that candlestick.

Now, we don’t want to just enter into a Short trade just because we see these 3 bearish candlestick patterns forming.
Instead, we want to only enter into a Short if it meets our conditions.
There are four ways in particular that I use these candlestick patterns to get into a Short trade:
- Break of Previous Swing Highs
- Double Top with Divergence
- Higher Highs with Divergence
- EMA Bounce in Downtrend with Divergence
1. Break of Previous Swing Highs
Step 1: Identify resistance levels of prior swing highs.
Look to the left of the chart for previous swing highs that have yet to be tested.
Then draw a horizontal line across it.
Step 2: Wait for the market to reach these horizontal lines.
We want the market to break above the previous swing highs and then wait for one of the three bearish candlestick patterns to be formed.
Step 3: Go short when the market closes below the low of the bearish candlestick patterns.
Here’s a trade example:

In the chart above, you can see that the market formed a swing high and formed its first Bearish Pin Bar there.
However, we do not go Short there because the Bearish Pin Bar is formed in isolation.
There’s no prior resistance level and it didn’t break any previous swing high.
Then the market went down a little from where it formed the first swing high.
And then it came back up to test the previous swing high as denoted by the horizontal line.
That’s where we want to observe whether any of the 3 bearish candlestick patterns will form.
In this case, it formed a Bearish Pin Bar.
However, we do not want to go Short yet.
It’s just our alert that a possible Short entry might happen.
We always wait for the market to close below the low of the Bearish Pin Bar.
Once it closes below the low, then we get into a Short trade.
Here’s another trade example where you have a few chances to enter into a Short trade:

You can see that the market has tested the previous swing high 3 times, and each time it formed a bearish candlestick pattern.
So the idea of this trade setup is simple…
Wait for price to break a previous swing high…
Then wait for one of the three bearish candlestick patterns to form…
Go Short when the market closes below the low of the bearish candlestick patterns.
2. Double Top with Divergence
For this trade, we will be using the double top chart pattern together with divergence.
If you’re not sure what divergence is, I explain it in detail here: Divergence Cheat Sheet
Step 1: Look for a double top formation in an uptrend.
Step 2: Confirm with the stochastic indicator that there is a divergence.
Step 3: Look for one of the 3 bearish candlestick patterns to form.
Step 4: Go Short when the market closes below the low of the bearish candlestick pattern.
Here’s a trade example:

On this chart, you can see that the market is in an uptrend and it has formed a double top formation.
At the same time, the stochastic indicator is making a lower high.
This indicates a divergence.
You can also see that a Bearish Pin Bar was formed at the second peak of the double top.
The next few bars after the Bearish Pin Bar starts to form inside bars.
This is not our entry.
When the market finally makes a push below the low of the Bearish Pin Bar’s low and closes below it, that’s our trigger to go Short.

3. Higher High with Divergence
This trade setup is similar to the double top trade setup.
We will also be looking for divergence on the stochastic indicator.
Except that we will be looking for higher highs.
Step 1: Look for the market to form higher highs.
Step 2: Confirm with the stochastic indicator that there is divergence.
Step 3: Look for one of the 3 bearish candlestick patterns to form.
Step 4: Go Short when the market closes below the low of the bearish candlestick pattern.

On the left-hand side of the chart, you can see that the market is an uptrend forming higher lows and higher highs.
However, the stochastic indicator is making a lower high which makes a bearish divergence.
A Bearish Pin Bar is formed at the last higher high and the next bar immediately closes below the low which signals our Short entry.
From there, the market eventually continued its way down.
4. EMA Bounce in Downtrend with Hidden Divergence
For this trade setup, we will be looking for the market to bounce off an EMA in a downtrend and confirm it with hidden divergence.
Step 1: Look for the market that is in a downtrend (20 EMA is below the 50 EMA).
Step 2: Wait for the market to retrace back to any of the EMAs.
Step 3: Confirm with the stochastic indicator that there is a hidden divergence.
Step 4: Look for one of the 3 bearish candlestick patterns to form.
Step 5: Go Short when the market closes below the low of the bearish candlestick pattern.

In the chart above, we can see that the market is in a downtrend with the 20 EMA below the 50 EMA, and is forming lower highs and lower lows.
At the point when the market retraced back to the EMAs for a second time, it finally formed a Bearish Pin Bar after some time.
The stochastic indicator was also indicating that a bearish hidden divergence has formed.
When the next bar closed below the Bearish Pin Bar, that’s the trigger to go Short.
Now, many of you might be wondering, why not go Short at the close of the Bearish Pin Bar?
Or go Short when the market breaks below the low of the Bearish Pin Bar?
You certainly can.
And that is the trader’s preference.
I prefer to wait for a close below the low of the bearish candlestick because many times the price will break below the low, get traders Short, and then reverse back up to the highs where the stop losses are, trigger it, and then come back down.
That’s price manipulation.
And believe it or not, it happens.
That’s what my prop firm did when I was at the equities desk.
With that said, if the candlestick that closes below the low of the bearish candlestick patterns is a long bar, I’d wait for it retrace to half the length of the bar to get Short.
Ultimately, it comes down to each trader’s trading style.
Conclusion
While there are tons of bearish candlestick patterns, there is absolutely no need to memorize each and every one of them.
These 3 bearish candlestick patterns that I’ve shared with you in this post will form the majority of Short trade entries you will have.
And it’s more than enough for you to get into high-probability trades on the Short side.
One more thing…
Did you like this post?
If you liked this post or felt it was helpful for you, would you please share it?
Remember, sharing is caring, and it won’t even take 5 seconds of your time.
So go ahead, click the share button below now to help more traders get an Edge trading the Forex market 
Thanks for this great post!
Glad you liked it.