
If there is a celebrity in the world of candlesticks, then the Pin Bar would be it.
It is one of the most widely recognized and used candlestick patterns when trading price action.
And that is because the Pin Bar can provide a very good risk-to-reward ratio when traded the right way.
However, not many traders trade it correctly.
In fact, most traders get killed trading the Pin Bar.
If you’re not profitable trading the Pin Bar, then you’re most likely trading it the wrong way.
So how then should you trade Pin Bars?
And how do you know exactly which Pin Bars you should be trading and which you should avoid?
In this guide, I’ll break down everything you need to know about the Pin Bars.
By the end of this guide, you will not only know the psychology behind these Pin Bars…
But you will also know exactly how to trade it…
And exactly which Pin Bars to avoid like the plague.
What Exactly Are Pin Bars?
Pin Bars are candlestick patterns that have a small body at the end of the candlestick with a relatively long wick.

However, I regard candlesticks that have bodies half the length of the candlestick as Pin Bars as well.
As long as the full body is located above or below the halfway mark, it can be considered a Pin Bar for our purposes.
And if you noticed, they can have either bullish or bearish bodies.
For Pin Bars, the color of the body doesn’t determine if it is bullish or bearish.
Instead, the body location determines that.
So if the body is located above the halfway mark, it’s considered a Bullish Pin Bar:

And if the body is located below the halfway mark, it’s considered a Bearish Pin Bar:

Now, some traders call the Pin Bar a Hammer candlestick.
The name is not important.
What’s important is you understand what the Pin Bar signifies.
The Pin Bar signifies a potential reversal in the market.
Where many traders get it wrong is that they think every Pin Bar is considered a reversal.
And so they trade every single Pin Bar and get their trading account wiped out.
How NOT to Trade Pin Bars
So which Pin Bars should you avoid trading?
There are two types of Pin Bars you should avoid trading:
- Pin Bars that appear out of the blue
- Long Pin Bars
Pin Bars that appear out of the blue are ones that do not appear as part of any valid setup.
Here is an example of a Pin Bar that appeared out of the blue:
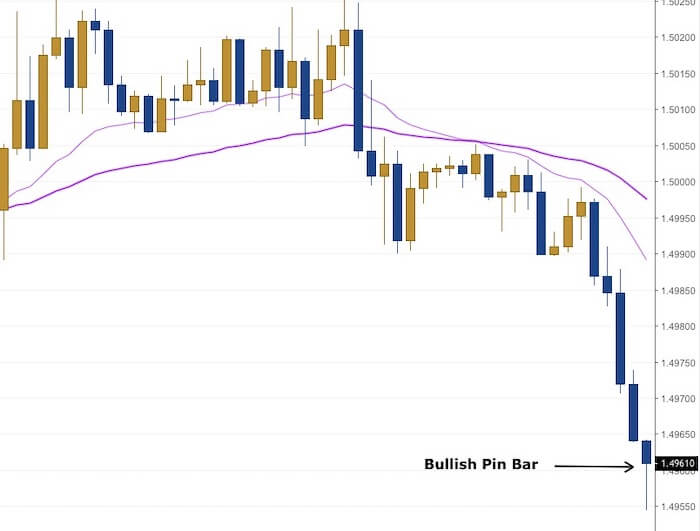
In the chart above, I’ve also plotted two Exponential Moving Averages (EMA) – the 20 EMA and 50 EMA.
You can see that the market has just transitioned from an uptrend to a downtrend…
The 20 EMA crossed below the 50 EMA with the market starting to make lower lows and lower highs as it moves below the 20 EMA.
This means the market is now considered to be in a strong downtrend.
When the market is in a very strong downtrend, you must be very careful about going Long.
No matter what bullish candlestick patterns you see, if the downtrend momentum is strong, the market most of the time will just run through it.
You can see that on the right-hand side of the chart is a Bullish Pin Bar formed.
Now, many beginner traders will see this and go Long after the Bullish Pin bar is formed.
Their thinking is that since the market has gone down quite a bit, it’s time for the market to go back up.
However, that’s flawed thinking because a market that has already gone down a lot can continue to go down further.
And likewise, a market that has already gone up a lot can continue to go up further.
So you must never get into a trade simply because of a single candlestick pattern…
Especially when you’re taking a trade that is against the trend.

As you can see in the chart, the next bar went below the Bullish Pin Bar and if you were in that trade, you would have been stopped out very quickly.
Now, on the right-hand side of the chart appeared another Bullish Pin Bar.
At this point, some of the beginner traders that got stopped out the first time might say:
“I think I can go Long again because the downtrend seems to be slowing down and weakening, so it might be time for a reversal. I will go Long again on this Pin Bar as I don’t think the market has any more strength to go further down.”
So they go Long again and this is what happens:

They get stopped out again.
This is the wrong way to trade Pin Bars, and you must never trade this way.
The other Pin Bar to avoid trading is a long Pin Bar like this:

You can see in the chart above that the Bearish Pin Bar is much longer than the other candlesticks.
This is usually caused by some news releases.
The reason we don’t want to trade such long Pin Bars is that it can be hard to get a good risk-to-reward ratio.
You see, normally after a piece of high-impact news is released, there will be a spike in volatility and the market can create long candlesticks like the Bearish Pin Bar.
And if you enter a trade on that Bearish Pin Bar, your Stop Loss would be quite far away from your entry point.
With a wide Stop Loss, you would require a wider Take Profit as well.
And the problem with that is that after the news has been released for a while, the volatility will die down and normalize to its usual volatility.
When that happens, it makes it harder to hit your Take Profit level.
So I generally tend to avoid long Pin Bars, and you should too.
Now that you know which Pin Bars to avoid, which Pin Bars should you then look for to trade?
How to Trade Pin Bars Like A Pro
One important thing I’d like to stress again is that when trading Pin Bars, you do NOT want to trade them on their own.
Pin Bars are not trading setups.
Pin Bars are entry triggers.
That means you first look for your trading setup.
Only once you have a valid trade setup, then you use the Pin Bars as confirmation of the trade.
Now, the words “valid setup” can be subjective…
Because many traders can say that their trading setup is just trading Pin Bars whenever they appear.
So my definition of a “valid setup” is one that makes sense.
Here are a few setups that I consider sensible and valid to trade the Pin Bars with:
- Support and resistance levels
- Chart patterns
- Divergence
While there are other valid setups for using the Pin Bars, the ones listed above are what I look for when trading Pin Bars.
When you trade Pin Bars with a valid setup, it will increase your odds of success.
Here’s an example…
Let’s say you see the market about to approach a key support level and you’re thinking of going Long.
However, you want to see that the market bounces off this support level to give you a signal to go Long.
Soper your trading setup, you’re looking for a Pin Bar to be formed at the key support level to give you an indication that the level will hold.
So as the market reaches the key support level, it bounces off it and forms a Bullish Pin Bar.
This then becomes your signal to go Long.
So what’s the trade setup here?
The key support level.
What’s the entry signal?
The Pin Bar.
So what you’re doing here is trading the support level and using the Pin Bar as confirmation to enter into a trade.
Now, before we get into the specific setups, you need to first know how to enter a trade with the Pin Bars.
Pin Bars Entry Methods
After a Pin Bar has been formed, how do you exactly get into a trade?
There are 3 types of entries:
- Entry Method #1: At the close of the Pin Bar.
- Entry Method #2: At the break of the high or low of the Pin Bar.
- Entry Method #3: At the close above or below the Pin Bar.
Let’s get into each one in detail.
1) Entry Method #1: At the close of the Pin Bar
The first type of entry is what I consider an aggressive entry.
To enter into a trade using this entry method, you simply wait for the close of the Pin Bar and then enter into a trade.
That means once the Pin Bar closes, you immediately go Long or Short using a Market Order.
A Market Order is to take the best available price at any given point in time.
This means to either “hit the bid” or “lift the offer”.
Here’s where you go Long for Bullish Pin Bars:

Here’s where you go Short for Bearish Pin Bars:

I consider this an aggressive entry because you do not wait for further confirmation that the market will go in the direction of your trade.
Further confirmation is to wait for the market to either break the high or low of the Pin Bar…
Or to wait for the market to either close above or below the Pin Bar.
And that’s the next two entry methods.
2) Entry Method #2: At the break of the high or low of the Pin Bar
The second entry method is to enter into a trade when the market breaks either the high or low of the Pin Bar.
This is the most common entry method that traders use.
Here’s how you Long or Short the Pin Bar using the normal entry:

For this entry method, you will be utilizing a Stop Order.
A Stop Order is essentially a Market Order but is only triggered when it reaches the trigger level that you set.
So in this case, the trigger level is above the high of a Bullish Pin Bar, or below the low of the Bearish Pin Bar.
When the market reaches either of these levels, it will immediately buy or sell at the best available price.
Hence, there is usually slippage.
And the stronger the move, the bigger the slippage.
An analogy is like doing a sudden jam brake when the car is moving at a high speed.
When the car does a sudden jam brake, it doesn’t stop right away.
Instead, it stops a small distance from when the car jammed brake.
The faster the car had been moving, the further away it will come to a complete stop because of the inertia.
That’s the same as using Stop Orders.
So for example, if you place a Buy Stop Order at 100.00, it’s possible to get filled only at 100.01.
3) Entry Method #3: At the close above or below the Pin Bar
The third entry method is the most conservative of all.
And that is to wait for a close above or below the Pin Bar before entering into a trade.
Here’s how you go Long or Short with this entry method:

To go Long, you wait for a close above a Bullish Pin Bar.
To go Short, you wait for a close below the Bearish Pin Bar.
Similar to the first entry method, you enter into a trade using a Market Order.
So that means once the bar closes above or below the Pin Bar, you either hit buy or sell.
The upside of this entry method is that you only enter once you have confirmed that the market is moving in the same direction of your trade.
That means if the market immediately reverses against the traders that entered using the first two methods…
Then by using this third entry method, you wouldn’t be affected as there would be no trade taken.
And that’s because the market did not close above or below the Pin Bar.
However, the downside of this entry method is that your risk-to-reward-ratio isn’t as good as the first two methods.
If you get an entry with this method, it means that you have entered into the trade later than traders using the first two entry methods…
And they would already be in the profit whereas you’re just starting from ground zero.
So how do you decide which entry method you should choose?
How to Decide Which Entry Method to Use
Now that you know the different entry methods, which one do you use?
Let’s compare the 3 entry methods when going Long (Shorts are the opposite):

From the diagram above, I’ve used a Bullish Pin Bar with a bearish body to illustrate the difference between the 3 entry methods.
Of the 3 entry methods, you can see that the first entry method has the tightest Stop Loss and the biggest risk-to-reward ratio…
And the third entry method has the widest Stop Loss and the smallest risk-to-reward ratio, based on the same Take Profit level.
So just from this diagram alone, the first entry method may seem like the best to use…
But is that really true?
We will have to see the pros and cons of each method to better evaluate all three entry methods.
So here are the pros and cons of using each method…
Entry Method 1: Enter at close
Pros:
- Can get a better risk-to-reward ratio for the same Take Profit level.
- A much tighter Stop Loss than the other two entry methods.
Cons:
- Get stopped out more often than the other two entry methods.
Entry Method 2: Enter at the break of high or low of the Pin Bar
Pros:
- A better risk-to-reward ratio than the third entry method.
- Don’t get stopped out as often as the first entry method.
- A balance between entry methods 1 and 3.
Cons:
- A worse risk-to-reward ratio than the first entry method.
- Get stopped out more often than the third entry method.
Entry Method 3: Enter at the close above or below the Pin Bar
Pros:
- Do not get stopped out as often as the first two entry methods. If the first two methods get stopped out immediately after getting into a trade, you won’t be affected because you wouldn’t be in the trade if the market did not close above the Pin bar.
Cons:
- The worst risk-to-reward ratio of the 3 entry methods for the same Take Profit level.
- To get the same R-Multiple profit as the first two entry methods, the market has to travel further from the entry point. For example, sometimes the market might hit the 2R Take Profit level for the first two entry methods, but then reverse immediately and hit the Stop Loss. That means the first two methods would have a 2R profit, but this method would have a 1R loss.
So as you can see, all three entry methods have their pros and cons and that’s the trade-off for each of them.
It’s up to you to decide which entry method is more suitable for your trading style.
Some traders prefer a bigger risk-to-reward ratio and don’t mind getting stopped out more often…
While some traders don’t mind a smaller risk-to-reward ratio as long as they don’t get stopped out as often.
I prefer the third entry method as I don’t get as many false signals…
But instead of entering at the close of the bar, I place a Limit Order below the close like this:

So if the candlestick that closed above the Bullish Pin Bar closes at 1.0050, I may choose to place a Buy Limit Order anywhere below it.
Exactly where I place my Buy Limit Order depends on how big the candlestick is, and where the Bullish Pin Bar closed.
This is a more advanced entry method and not necessarily for everyone.
However, the upside to this is that I can have a much better risk-to-reward ratio than if I were to go Long at the close of the bar.
On top of that, with a Limit Order, there is no negative slippage.
Instead, I might even get a positive slippage, which means I get a better entry than the level I entered the Limit Order in.
So if I place a Buy Limit Order at 1.0030, with positive slippage, I may get filled at 1.0029.
Now, the downside to this entry method is that I can miss trades that would have otherwise been profitable.
For example, after the candlestick closes above Bullish Pin Bar, the market might just continue going up and never come down to fill my Limit Order.
But I’m fine with that because, in the long run, I’m still profitable.
So it comes down to you to decide which is the best entry method that’s the most suitable for your trading style.
Now that you know the 3 entry methods, it’s time to get into the specific trading setups.
Trading Setups to Use Pin Bars
To trade these Pin Bars, there are two setups that you can use:
- Pullbacks with the trend
- Double Tops & Double Bottoms reversal patterns
Pullback With the Trend
If you’ve been reading my blog for some time now, then you will know that trading pullbacks are one of my bread and butter trading setups.
If you’re unfamiliar with what pullbacks are, they are retracements in a trend.
So for example, in an uptrend, the market will make higher highs and higher lows like this:

The higher lows are the pullbacks in an uptrend.
And in a downtrend, the market will make lower lows and lower highs like this:

The lower highs are the pullbacks in a downtrend.
So when these pullbacks happen, we want to see if a Pin Bar forms.
However, we don’t want to trade every Pin Bar that forms in a pullback.
We only want the high probability ones.
So how do you determine which are the Pin Bars that have a high probability of working out?
By trading the Pin Bars that form on the Exponential Moving Average.
Many times, the EMAs serve as dynamic support and resistance levels.
So when the market reaches the EMA, there’s a chance that it might bounce off it.
What I like to use is the 20 EMA and 50 EMA as mentioned earlier.
So what I’m looking for is for the market to come to either of the two EMAs and then form a Pin Bar.
This is what we’re looking for:

However, we’re not done…
We still want one further confirmation, and that is using Hidden Divergence.
For hidden divergence, we use the Stochastic Oscillator.
So what I’m looking for on the Stochastic Oscillator is for a divergence in price.
In an uptrend when the market is making higher lows, I’m looking for the Stochastic Oscillator to show a lower low.
And in a downtrend when the market is making lower highs, I’m looking for the Stochastic Oscillator to show a higher high.

Let’s take a look at a few chart examples.

The chart above is the 60-minutes chart on USDJPY.
From the left-hand side of the chart, you can see that the market is in a strong uptrend.
The 20 EMA is above the 50 EMA, and the market is forming higher highs and higher lows above the 20 EMA.
In the middle of the chart, the market did a pullback to the 50 EMA and then formed Bullish Pin Bar.
So this is an indication that the 50 EMA is holding up as a dynamic support level.
At the same time, there is a hidden divergence.
The market is forming higher lows, but the Stochastic Oscillator is showing a lower low.
So in this trade, we have a confluence of 3 elements working for us:
- The market is in an uptrend so we are trading in the direction of the trend.
- We have a Bullish Pin Bar that formed on the 50 EMA suggesting there’s support there.
- The Stochastic Oscillator is indicating a divergence.
When you have these 3 elements in your favor, the trade becomes a high probability one.
Let’s take a look at another example.

The chart above shows a Bearish Pin Bar on the AUDUSD 60-minutes chart.
This is an interesting example because the Bearish Pin Bar is a “fake-out” on the previous bearish candlestick pattern which is a Dark Cloud Cover.
Traders who trade the Dark Cloud Cover would typically go Short at the close of the previous bar and place their Stop Loss above the high of the candlestick.
In this case, they would have been stopped out because the Bearish Pin Bar had initially broken above the high of the Dark Cloud Cover, and then came back down below the low of it.
So whenever this happens, this is considered a strong bearish signal.
At the same time, the Bearish Pin Bar also formed on the 50 EMA which serves as a dynamic resistance line.
And if you look at the Stochastic Oscillator, it’s showing hidden divergence as well…
The market is making lower highs but the stochastic indicator is showing a higher high.
So again, we have a confluence of bearish signals, making this trade a high probability one.
As you can see, not too long after the Bearish Pin Bar was formed, the market started going down.
Double Bottoms & Double Tops Reversal Patterns
The next trading setup you can use to trade the Pin Bar is using the Double Top and Double Bottom reversal pattern.
If you recall earlier, I mentioned that when the market is in a strong uptrend or downtrend, you do not want to randomly enter into a trade using the Pin Bars.
The way to do it safely is through these two reversal patterns.
So what are Double Bottoms and Double Tops?
They are chart reversal patterns that you usually find at the end of a trend.
These two patterns signify a possible reversal in the trend.
Here’s how a Double Bottom looks like:

The Double Bottom is usually found at the end of a downtrend.
And if you noticed, the market is always trading below the two EMAs.
The Double Top is the opposite:

The Double Top is a bearish reversal signal and it is usually found at the top of an uptrend.
For a Double Top to form in an uptrend, it’s always above the two EMAs.
So how do we trade the Pin Bars on these two reversal patterns?
On the Double Bottom, we are looking for a Bullish Pin Bar to form at the second bottom like this:

Ideally, we want the Bullish Pin Bar to break the low of the first bottom…
And then come back up to close above it.
But, of course, that doesn’t happen all the time.
Sometimes it doesn’t reach as low as the first bottom…
And sometimes it doesn’t close above the first bottom’s swing low.
In both cases, we consider them Double Bottoms as well as long as they are not too far from each other.
This is the same for the Double Top.
For the Double Top, we are looking for a Bearish Pin Bar to form at the second top like this:

And ideally, we want the Bearish Pin Bar to break the high of the first top’s swing high, the come back down to close below it.
Now, many times this is more than sufficient to trade both reversal patterns.
That means you first wait for a Double Top or Double Bottom to form…
Then you wait for a Pin Bar to form on the second top or bottom…
And then you enter into a trade using one of the entry methods mentioned above.
However, we are smart traders…
And that means we want an additional confirmation to signify we have an entry.
And this additional confirmation is a divergence on the Stochastic Oscillator.
In the Pullback trade setup, we are looking for Hidden Divergence.
But for the Double Bottoms and Double Tops, we are looking for Regular Divergence.
Here’s what we are looking for on a Double Bottom trade:

In the diagram above, you can see the while the market is forming a Double Bottom, the Stochastic Oscillator is showing a higher low.
This is what we call Regular Divergence, which is different from Hidden Divergence.
With Hidden Divergence, it is used when trading with the trend.
With Regular Divergence, it is used when trading against the trend.
Here’s what we are looking for on a Double Top trade:

While the market is forming a Double Top, the Stochastic Oscillator is showing a lower high.
We only trade the Double Bottoms and Double Tops with a divergence to give us a high probability of the trade working out.
Here’s a chart example of a Double Bottom trade:

This is a chart of the USDCHF 60-minutes timeframe.
As you can see, from the left-hand side of the chart, the market is in a strong downtrend.
The market is moving well below the 20 EMA and at the first bottom, you noticed that there is also a Bullish Pin Bar formed.
And as mentioned before, you don’t want to go Long just because you see a Bullish Pin Bar.
Instead, we wait till a Double Bottom is formed.
As you can see in the chart, another Bullish Pin Bar is formed at the second bottom.
And it’s formed on the previous swing low level which acts as a support level as well.
Furthermore, the Stochastic Oscillator is showing a divergence with a higher low.
If you used the first two entry methods, you would have gotten a very good risk-to-reward ratio on this trade as the bar after the Bullish Pin Bar shot up.
But if you had used the third entry method, you would probably still be in the trade even at the candlestick at the right-end of the chart.
But generally, if you see such a long candlestick, you shouldn’t go Long at the close of it.
Instead, place a Buy Limit Order somewhere around the halfway mark of the candlestick or lower to get a better entry.
This way you can still get a decent risk-to-reward ratio.
Now, let’s take a look at a Double Top example.
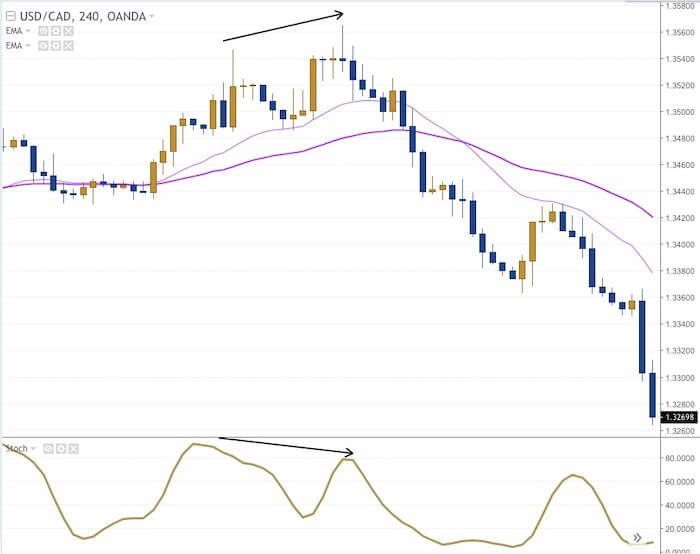
This is a trade on the USDCAD 4-hour chart.
As you can see, on the left-hand side of the chart, the market is making higher highs and higher lows forming an uptrend wave.
Then it formed a Double Top with a slightly higher high.
At the second top, a Bearish Pin Bar is formed.
And the Stochastic Oscillator is showing a lower high for a divergence.
Regardless of which entry you used, you would still be able to get a good risk-to-reward ratio as the market started to tank hard.
Conclusion
Many people love to trade the Pin Bar, but not many actually know how to trade it the right way.
With this guide, you don’t have an excuse to trade it the wrong way now.
So here’s a summary of what you have learned in this guide to trading Pin Bars:
- Don’t trade Pin Bars as a standalone.
- Only trade them with the right setups.
- To enter a trade with Pin Bars, there are 3 entry methods. Use the one that fits your trading style and then test that it works for you.
- To enter into pullback with Pin Bars, look for a trending market and for the Pin Bar to be formed on either of the EMAs. Then look to the Stochastic Oscillator to see if there is a hidden divergence. Only enter into a trade if these conditions are met.
- To enter into a Double Bottom or Double Top pattern with Pin Bars, look for the Pin Bar to be formed on the second bottom/top. Then look for the Stochastic Oscillator to see if there is a regular divergence. Only enter into a trade if these conditions are met.
Pin Bars can be a double-edged sword.
Trade them the wrong way, and you will get your trading account wiped out fast.
But if you trade them the right way, just this candlestick pattern alone is more than enough for you to be profitable in the long run.
You ultimately decide which way you want to trade it.
One more thing…
Did you like this post?
If so, would you please share it?
Remember, sharing is caring, and it won’t even take 5 seconds of your time.
So go ahead, click the share button below now 
Leave a Reply