
Wonder how you can catch big moves in the market?
Then you might want to consider using a volatility trading strategy.
Professional traders are always devising new strategies to use volatility to their advantage.
However, that also means that it’s possible that volatility can be a disadvantage.
That’s because trading volatility can be a two-edged sword.
Trade it correctly, and you will reap big rewards.
But trade it wrongly, and you will lose your money faster than you can finish reading this whole post.
So before you dive into any volatility trading strategies…
Or start trading in a highly volatile market…
There are things that you must know and understand about volatility.
What Exactly is Volatility?
Volatility is simply how much of the market moves in a given period of time.
The more a market moves in a short period of time, the more volatile the market is considered to be.
And to measure that, we can use the ATR (Average True Range) indicator found on most trading platforms.
The ATR indicator basically tracks the market’s range of movement over a set period of time as defined by the trader.
The default setting is over the last 14 periods.
This can be 1-min periods all the way up to monthly or even yearly periods.
Let’s use ATR (14) on the 1-hour chart as an example on the EURUSD.

You can see that it shows a value of 10 pips (highlighted in red on the right-hand side of the ATR indicator row).
That means on average over the past 14 bars on the 1-hour timeframe, EURUSD had a range of x pips.
But is 10 pips considered volatile?
You see, volatility is relative.
It may be considered volatile on EURUSD, but considered low Volatility on GBPJPY.
And here’s where the problem lies for many traders…
High Volatility Means Higher Risk
Many traders think that the more volatile the market or currency pair is, the more profitable it will be.
That’s why some traders search for the most volatile currency pairs and trade currency pairs like USD/ZAR thinking it will give them the most bang for their buck.
But that is flawed thinking.
Volatility does not necessarily equal high profitability.
In fact, the more volatile the market, the riskier it’s deemed to be.
For example, when markets head into volatile news, brokers will widen their spreads, and will also reduce the leverage should they feel the need to.
Take this email from IC Markets as an example:
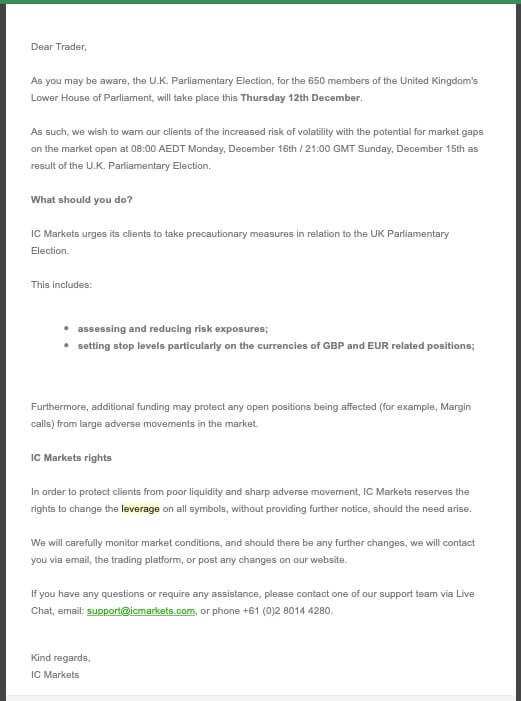
In the email, it’s stated that:
“In order to protect clients from poor liquidity and sharp adverse movement, IC Markets reserves the rights to change the leverage on all symbols, without providing further notice, should the need arise.”
When there is high volatility, there can be bigger than normal slippage as well.
So while you may have a Stop Loss in place, it’s possible that you can still lose more than what you risked for the trade.
Back in early 2015, there was a huge move in the Swiss Franc when the currency was unpegged from the Euro.
This caused a huge crash in the market:

In the chart above, you can see the EURCHF dropped from 1.2000 to around 0.9800.
That a 2000+ pip move in just one day when the average daily range was around 30 pips at that time!
And because of this move, the Forex broker Alpari went insolvent.
So it’s important to understand that high volatility can also lead to higher potential losses if you’re not careful.
Alright, now that we understand the risks involved when trading highly volatile situations, how then do you trade volatility?
By having a setup that precedes an expected volatile event.
Low Volatility into High Volatility
So what we want to establish is that volatility should not be measured between different markets, but rather relative to its own movement.
So the volatility trading strategies we want to look at is when the market makes a sudden move out of the normal volatility.
That means a low volatility situation into a high Volatility one.
And there are 3 strategies that professional traders use to capture these big volatile moves in the market.
Volatility Trading Strategy #1: The Squeeze
The first trading strategy that aims to capture a big move in an increase in volatility is called The Squeeze.
I found out about this strategy over a decade ago when I first read the book Mastering The Trade by John F. Carter.
In his book, he talked about a strategy that uses the Bollinger Bands and Keltner Channel to catch a breakout in the market.
It attempts to take advantage of quiet periods in the market when the volatility is lower than normal, and then get into a trade when the volatility picks up.
A common application of this is when the Forex market is transitioning from the Asian trading sessions to the London trading session.
Since the Asian trading session tends to have lower trading activity compared to the other trading sessions, the volatility is lower.
And the trading activity is at its highest when a market trading session is in the first hour of its open.
Hence the tapering off of volatility from the Asian trading session going into the open of the London market causes a nice surge in volatility.
For this strategy, 3 indicators are used:
- Bollinger Bands using settings of 20 and 2.0.
- Keltner Channel using settings of 20 and 1.5.
- Momentum Oscillator with a period of 12 and on the close.
Here’s how the strategy works:
Step 1: Wait for the Bollinger Bands to go inside the Keltner Channel.
Step 2: Wait for the Bollinger Bands to expand out of the Keltner Channel.
Step 3: If the Momentum Oscillator is above zero, go Long at the close of the candle.
If it is below zero, go Short at the close of the candle.
Step 4: In the book, John gives a fixed Stop Loss for different instruments.
For example, for stocks he uses a 50 cents Stop Loss and for the EURUSD he uses a 20-pips Stop Loss.
However, those are parameters from the book that’s taken over a decade ago.
The volatility has changed since then and so we need to adapt the Stop Loss.
A simple way to place Stop Loss is by placing it below the previous swing low/high or a fixed multiple of ATR.
Step 5: In the book, John closes the trade when the Momentum Oscillator shows a weakening in momentum.
So if you’re in a Long trade, close the trade when the Momentum Oscillator goes below zero.
And if you’re in a Short trade, close the trade when the Momentum Oscillator goes above zero.
Let’s take a look at a few examples.
Long Trade on USDJPY (15-Min Chart)

This is an intraday trade on the USDJPY on the 15-mins chart.
Just before Bollinger Bands contract and enter into the Keltner Channel, you can see that the market has started to consolidate.
There was an initial move towards the top of the Keltner Channel where the market closed above the Keltner Channel.
However, the Bollinger Bands have not expanded beyond the Keltner Channel so there was no trade there.
About 6 bars later, the market started to break below the Keltner Channel and the Bollinger Bands started to move out of the Keltner Channel as well.
When the bar closed below both the Keltner Channel and the Bollinger Bands, the Momentum Oscillator was below zero.
That was the signal to go Short.
From there, the market started to move down pretty quickly.
Our exit was when the market started to retrace back into the Keltner Channel, and the Momentum Oscillator went above zero.
Let’s take a look at another trade example.
Long Trade on EURUSD (4-Hour Chart)

This is trade on the EURUSD on the 4-hour chart.
For this trade, the market formed a long bar up and the Bollinger Bands went outside the Keltner Channel on the next bar.
The Momentum Oscillator was showing a reading above zero and hence we enter into a Long trade.
However, this trade was pretty short-lived because after a few bars later, the Momentum Oscillator went below zero, and that was our signal to exit the trade.
This trade was a breakeven trade.
The market eventually went further up, but there was no valid signal to enter into a trade as the Bollinger Bands did not fully go inside the Keltner Channels after closing our trade.
Now, if you noticed both charts, you will notice that the market always goes into a consolidation mode when the Bollinger Bands enter the Keltner Channel.
So what this strategy is really aiming to do is to identify when the market is quiet and consolidating, and then get positioned to get into a trade when a breakout of the consolidation happens.
Volatility Trading Strategy #2: Straddling News
This strategy is simple but can be tricky to execute.
The basis of this strategy is to capture a big movement in the market when a piece of high-impact news comes out.
One of the reasons why many traders say to avoid news is because of high volatility during these times.
Spread can widen greatly and there can be big slippage in the execution of trades.
So choosing a good broker that can handle high-impact news events is important for this strategy to work well.
Here’s how the strategy works:
Step 1: Identify high-impact news.
Go to the calendar section at ForexFactory.com.
Once you’re there, click the “filter” icon at the top right-hand of the table:

Then uncheck all the boxes except for the red color one which indicates that you only want to see the high-impact news.
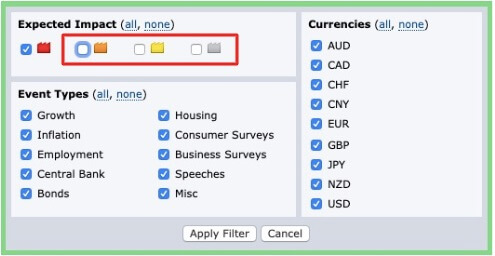
After that, all you will be left with is all the high-impact news for the whole week.

Step 2: Choose the currency pairs that will have high-impact news for the day.
For this strategy, use a 5-minute chart.
Step 3: Place a buy and sell order 5 minutes before the news is released to “straddle” the market.
Place a buy stop order 10 pips above the close of the last candlestick with a Stop Loss of 10 – 15 pips.
And place a sell stop order 10 pips below the close of the last candlestick with a Stop Loss of 10 – 15 pips.
This will give a straddle length of about 20 pips wide between the buy and sell orders.
Placing these orders can be quite tricky because the market will constantly be moving.
So if the market makes a move of 10 pips from the close of that last candlestick and the news is not out yet, then you will have to adjust your buy and sell orders accordingly.
Hence I mentioned that this strategy isn’t very easy to execute as you have to be quick with placing your orders and knowing where to place them.
Step 4: As for the Take Profit level, there are two ways to do this:
- Trail your Stop Loss every 1R (10 – 15 pips).
- Set a fixed Take Profit level at 3R (30 – 45 pips) or more.
Let’s take a look at an example on the EURUSD (5-Min Chart):
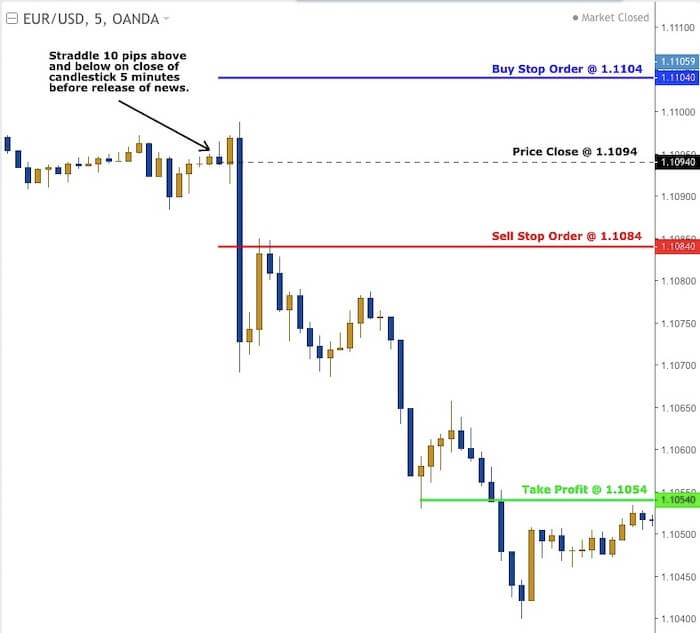
This trade was placed during the FOMC Statement news release.
On the left-hand side of the chart, you can see that the market has been very quiet leading up to the FOMC Statement news.
This is very typical just before a major news release.
So 5 minutes before the news is released, we want to identify the closing price of the candlestick on the 5-mins chart.
The close is at 1.1094.
So we place a buy stop order 10 pips above at 1.1104.
And we place a sell stop order 10 pips below at 1.1084.
Our Take Profit is at 3R at 1.1054.
When the news is released, the market immediately went down and it eventually hit our Take Profit level.
Now, while this might seem really lucrative, it can be very risky because of the negative slippage and the possible widening of the spread.
Certain brokers will even widen their spread to over 10 pips for such high-impact news, making this strategy not very viable.
Some brokers will also give you a big slippage of several pips.
So when trading this strategy, you want to make sure that the broker you’re using will not widen their spread during such high-impact news.
Volatility Trading Strategy #3: Fading Spikes
Unlike the first two strategies where the trade direction is in the direction of the price movement, this strategy uses the opposite.
It doesn’t try to catch the beginning of a big move, but rather wait till the big move has happened, and then fade it.
The idea behind this trade is that there are big players (market makers & banks) in the market that are manipulating the price for a very short moment.
Manipulation, believe it or not, is happening all the time in the market.
When I was a prop trader trading the stock market, we would also manipulate the order book to create false buying and selling demand in order to make a few ticks.
So for this strategy, the idea behind the manipulation is that the big players are trying to take out stops and then reverse their position.
And they do it by targeting obvious Stop Loss placements at swing highs and lows.
So what they would do is push the market very briefly to hit these levels and then reverse.
And that creates a long candlestick bar.
Here’s how to trade this strategy:
Step 1: Mark all previous swing highs and lows that have not been broken.
Step 2: Wait for a long candlestick bar to form.
It has to be a long bullish or bearish bar that is much longer than the other bars on that timeframe.
Step 3: Wait for the market to break above/below the previous swing high/low in the next few bars.
Step 4: Look for a bullish or bearish candlestick pattern to form.
Step 5: Wait for the market to close above/below the previous swing high/low.
Step 6: Enter into a Long/Short trade at the break of the high/low of the bar.
Let’s take a look at an example to illustrate what I mean.

So first of all, draw a line across all previous swing highs.
I also add two Exponential Moving Averages (20 EMA & 50 EMA) to give me an idea of the market’s general direction.
Then wait for a long bullish bar to break any of the previous swing highs.

You can see at the right-hand side of the chart, a long bullish bar has formed.
It also broke above the previous swing high.
So now we want to wait for a bearish candlestick pattern to form.

A Bearish Pin Bar has formed in the next bar.
Go Short at the break of the low of the Bearish Pin Bar.
Place Stop Loss above the swing high.
Place Take Profit at 1.5R or 2R.

The market went down very quickly to hit the 1.5R Take Profit level in just 2 bars.
But it also eventually hit the 2R Take Profit level.
Once this trade has closed out, we now want to mark where the new swing highs are.
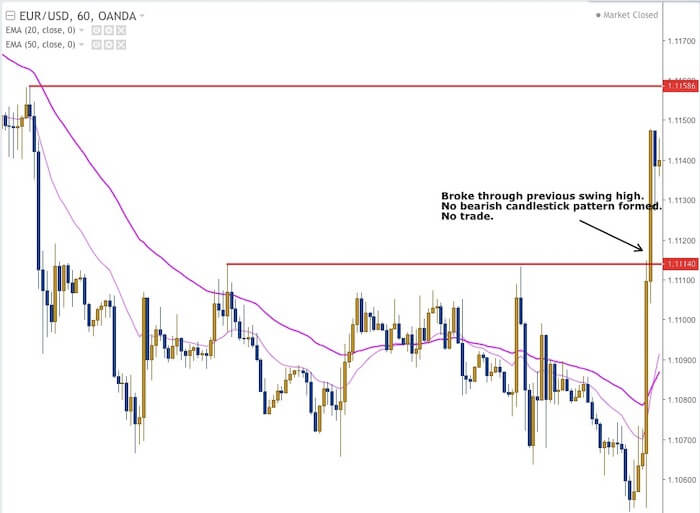
The market made a huge move up and broke past the previous swing high.
However, it did not make a bearish candlestick pattern.
So there’s no trade.
The market continues to move up strongly and is about to approach another previous swing high.

The market finally reaches the previous swing high and breaks above it.
And it formed a Bearish Pin Bar.
However, we don’t go Short yet.
We want to wait for a break below the low of the bar to go Short.

The market breaks below the low of the Bearish Pin Bar and we go Short at 1.1148.
We place the Stop Loss just above the high of the Bearish Pin Bar at 1.1168.
Then place the Take Profit level at either 1.5R or 2R.
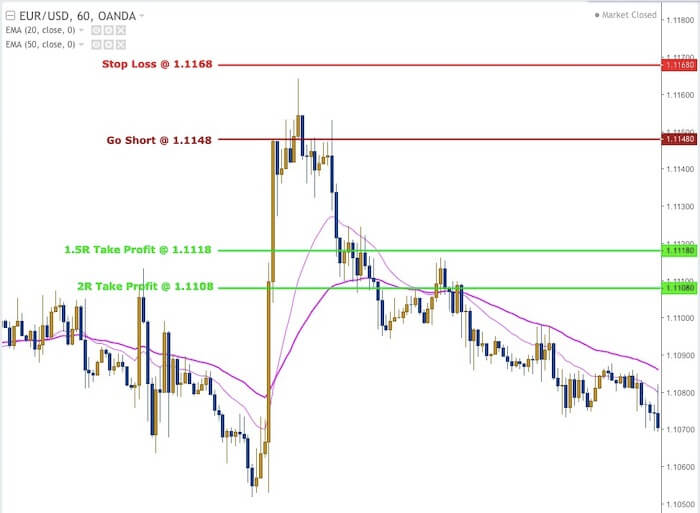
The market eventually hit both Take Profit levels and went even further down.
There you go.
These are the 3 volatility trading strategies that professional traders use to trade volatility to their advantage.
Volatility can be a double-edged sword, and many traders have been burned trading it the wrong way.
But if you manage your risk well and use volatility to your advantage using these strategies, then it can work out for you.
One more thing…
Did you like this post?
If you liked this post or felt it was helpful for you, would you please share it?
Remember, sharing is caring, and it won’t even take 5 seconds of your time.
So go ahead, click the share button below now to help more traders get an Edge trading the Forex market 
Excellent article Davis, you make understanding so simple. Thank you!
My pleasure 🙂
Hello Davis,
thank you very much for the Strategies. Especially number one sounds very interesting to me. Why don’t you post videos with live trades using this strategies? I’m sure this would be interesting to a lot of traders looking for a new strategy or improving they own. Would like to get feedback on this idea and would be very happy to see some live trades using strategy #1.
Best regards,
Daniel
Haven’t actually thought of creating any videos at the moment but will certainly consider doing so for future posts. Thanks for your feedback 🙂
Hello Davis,
I have problems with the squeeze strategy. It doesn’t really work out on the M15 chart. It happens often that a candle breaks out of the Keltner Channels and Bollinger Bands and another candle opens above/below it, the BB’s also leave the Keltner Channel in that moment, momentum is also in confluence. But often the candle after the trigger candle goes in the exact opposite direction. Nevertheless I like the strategy because it makes sense to me. Could you give me an advise how to avoid those fake breakouts and determine whether there will be a consistent breakout?
Thanks in Advance!