
The Bull Flag Pattern is one of the most common chart patterns that appear in an uptrend.
In fact, every time there is an uptrend, this pattern will appear.
If you want to trade with the trend, then this pattern can give you a good entry when traded right.
However, not many traders know how to trade this pattern properly.
When traded wrongly, you will get your trading account wiped out.
But when traded correctly, this can give you some of the highest risk-to-reward trades you can have.
So how do you exactly trade the Bull Flag Pattern?
And which ones should you avoid like the plague?
In this guide, I will get into the details so that by the end, you will know exactly how to spot a Bull Flag Pattern accurately…
And be able to trade it confidently and profitably.
What is a Bull Flag Pattern?
In trading, there are generally two types of chart patterns – continuation patterns and reversal patterns.
The Bull Flag Pattern is continuation pattern.
It is a bullish chart pattern that signifies a continuation in an uptrend.
In an uptrend, the market has to establish waves like this:

In order for the market to go higher, it has to form higher highs and higher lows.
These “higher lows” are pullbacks or retracements in an uptrend.
And many times, these pullbacks form a Bull Flag Pattern.
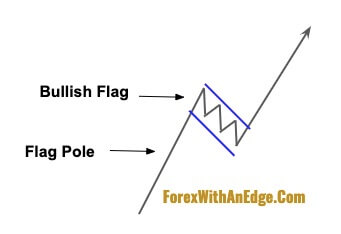
This is how it looks like:
So in a way, Bull Flag Patterns are pullbacks in an uptrend.
Why do Bull Flag Patterns form?
You see, when a market goes up, it never goes straight up.
You never see a market that just goes up in a straight line without these pullbacks.
These pullbacks are like the market taking a breather before continuing in its move upwards.
It’s like a “rest” period before the market continues on its way.
So in a sense, the Bull Flag Pattern is like a “pit stop” before going up again.
However, not all pullbacks lead to a Bull Flag Pattern.
So it’s important to know how to identify a Bull Flag Pattern properly, and how to trade it.
In an uptrend, the Bull Flag Pattern can appear many times.
But you don’t want to trade it every time it appears.
So how do you identify which ones to trade and which ones to avoid?
How to Trade the Bull Flag Pattern
Before you can trade a Bull Flag Pattern, you need to first know how to identify one.

If you take a look at the chart above, you will notice there are two Bull Flag Patterns that I’ve identified.
I’ve also added two Exponential Moving Averages (EMA) – the 20 EMA and 50 EMA.
The two EMAs aid in helping us identify an uptrend easily.
When the 20 EMA is above the 50 EMA, we consider the market to be in an uptrend.
So we only want to start looking for the Bull Flag Pattern when the 20 EMA has crossed above the 50 EMA.
If the 20 EMA is still below the 50 EMA, we won’t bother looking.
So why only look for a Bull Flag Pattern above the 20 EMA?
That’s because when the market is trading above the 20 EMA, it means there is strong momentum to the upside.
And any Bull Flag Patterns that are formed above the 20 EMA have a higher chance of it working out.
So how a Bull Flag Pattern typically forms is that it starts with a strong upward move which forms the “flagpole”.
And when the market starts to do a pullback, it can start to form the “flag”.
If there is still strong momentum to the upside, the pullback distance will be shorter and slower than the distance formed by the flagpole.
In the first Bull Flag Pattern (bottom left-hand side of the chart), you can see that this is when the market first moved above the 20 EMA and 50 EMA.
After this, it started to go down about 4 candlestick bars before going back up again.
In the second Bull Flag Pattern, there is a long flag pole as the market made a strong move upwards.
Then it started to slowly move down to the 20 EMA.
If you noticed, it took only 5 candlestick bars to reach the top of the Bull Flag Pattern:

However, the flag itself took 12 candlestick bars.
This is what I mean by the “slowing” of the market when making a pullback.
So this is the Bull Flag Pattern that we are looking for on our charts.
Now, these two Bull Flag Patterns have something similar as well…
And that is that both of them bounced off the 20 EMA.
The 20 EMA, in this case, acted as a dynamic support level.
So here are the criteria that we’re looking for to trade the Bull Flag Pattern:
- The 20 EMA is above the 50 EMA.
- The market is trading above the 20 EMA.
- The flagpole has lesser candlestick bars than the flag.
- The Bull Flag Pattern bouncing off the 20 EMA.
Now that you know the criteria, let’s get into the details of how you enter into a trade.
How to Enter Into A Trade
To enter into a trade using the Bull Flag Pattern, we want to look for a bullish candlestick pattern that forms on the 20 EMA.
While there are many different bullish candlestick patterns, all you need to know to trade the Bull Flag Pattern are these 3 candlesticks:
- Bullish Pin Bar
- Bullish Piercing Pattern
- Bullish Engulfing Pattern
These 3 bullish candlestick patterns are more than enough to trade the Bull Flag Pattern as the are the most common candlestick patterns to appear.

The diagram above shows exactly what you want to look out for on the charts.
These 3 candlestick patterns are the trigger for us to get into a trade.
Now, there’s a reason why we want to look for a bullish candlestick pattern as opposed to just any candlestick forming…
And that is that when you have a bullish candlestick that forms on the 20 EMA, it suggests that the EMA has held up as a dynamic support level.
Furthermore, a bullish candlestick pattern suggests that the market has a good chance of going up after its formation.
Hence, you want a confluence of these two elements to give you a high probability of the trade working out.
So how do you enter into the trade once these bullish candlestick patterns appear?
There are 3 entry methods:
- Entry Method #1: Enter at the close of the bullish candlestick pattern.
- Entry Method #2: Enter at the break of the high of the bullish candlestick pattern.
- Entry Method #3: Enter at the close above the high of the bullish candlestick pattern.
The first entry method is the most aggressive entry of all because you do not wait for a confirmation of the bullish move.
By confirmation, it means to wait for another event to happen to give you a better indication that the market will be going up.
This event is either the break of the high of the bullish candlestick (Entry Method #2), or a close above it (Entry Method #3).
So Entry Method #3 is the most conservative and method, and Entry Method #2 is a balance between the two.
Here’s how each of the entry methods looks like :


With Entry Method #1, you will have the best risk-to-reward ratio for the same Take Profit level…
But the trade-off is that you will get stopped out more often.
With Entry Method #3, you will have the worst risk-to-reward ratio for the same Take Profit level…
But the upside is that you won’t get stopped out as often.
Entry Method #2 is a balance of the two entry methods.

In the diagram above, I’ve used the example of the Bullish Pin Bar with a bearish body to illustrate the risk-to-reward ratio.
Stop Loss is placed below the low of the bullish candlestick patterns.
So how do you decide which entry to use?
It depends on your trading style.
Do you like to get a high risk-to-reward ratio but a lower win rate?
Or do you prefer to get a lower risk-to-reward ratio but a higher win rate?
The best way is to test all 3 entry methods to see which actually works for you, and which best suit your trading style.
But if you want to play it safe, then go with Entry Method #3.
Increasing the Bull Flag Pattern’s Probability with Divergence
With any trading setup, the more signals you have supporting the direction of your trade, the higher the chances of your trade working out.
That is called a confluence of trade signals.
And if you’re planning to go Long, then the more bullish signals you have, the higher the probability of the market going up.
So what other confluence of trade signals should you be looking for?
Now, the Bull Flag Pattern can be traded in any market.
In the Stock Market, many traders use volume as an added confluence of trade signals.
So when traders trade the Bull Flag Pattern in the Stock Market, what they want to look out for is for an increase in volume when the market starts moving up from the Bull Flag Pattern.

In the chart above, you can see that the volume has increased when the market broke out from the Bull Flag Pattern.
This shows that there are buyers coming in to push the market up.
And this gives traders an added validation that the Bull Flag Pattern has a higher chance of working out.
However, in the Forex Market, we can’t use volume because there’s no centralized exchange.
That means the volume you see in the Forex market is not an accurate representation of the total volume in the market.
Rather, the volume shown is only of the broker’s own transaction volume.
That means it’s not accurate or reliable compared to how stock traders use it.
So what do we do in this case?
We use the added confluence of a divergence.
A divergence is when the market is moving in a different direction than our indicator.
Now, there are a few indicators that can identify divergence…
But what I like to use is the Stochastic Oscillator.
So for our purpose, we will be using the Stochastic Oscillator to identify divergence.
Since I use TradingView as my charting platform, my examples will show the Stochastic Oscillator from there.
But you can use the Stochastic Oscillator MT4 platform as well.
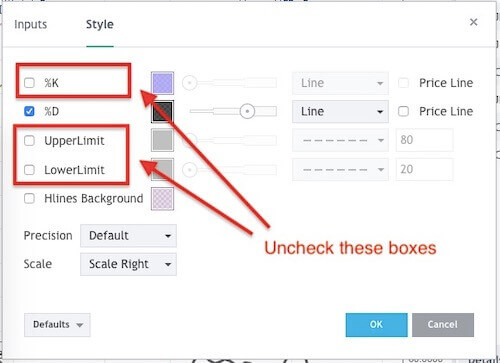
The settings we will be using for the Stochastic Oscillator is as follows:

And we will only be using the %D setting and unchecking the other options:
To identify a divergence on the Bull Flag Pattern, what we’re looking for is for the market to be forming a higher low but the Stochastic Oscillator to form a lower low.

In the diagram above, you can see that the market has formed a higher low while the Stochastic Oscillator has formed a lower low.
This is called a hidden divergence.
So at the point where the bullish candlestick pattern is formed, we want the Stochastic Oscillator to form a lower low.
Here’s how it looks like on the chart:
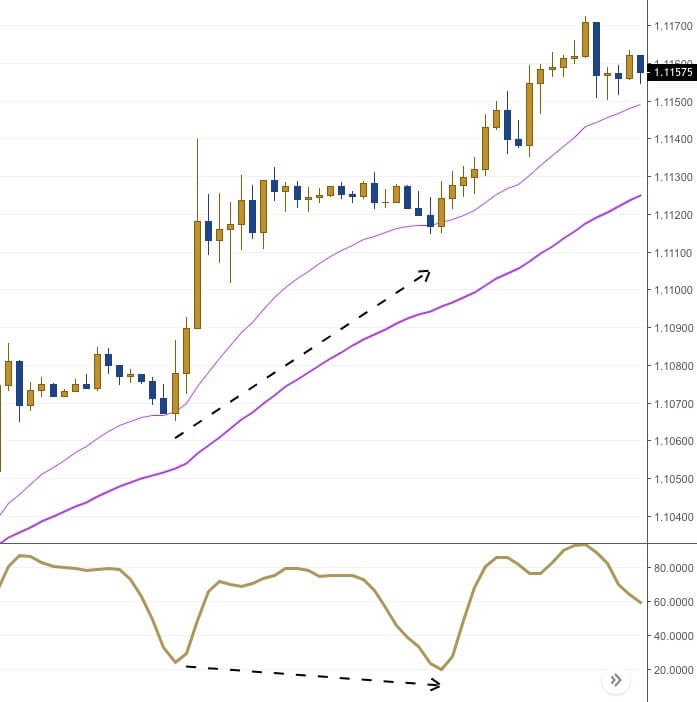
The chart above shows a hidden divergence.
As you can see, the market is making a higher low but the Stochastic Oscillator is making a lower low.
So whenever you are looking for an entry, you want to see that there is a hidden divergence to give you the added confluence that the Bull Flag Pattern will work out.
Alright, let’s put everything together so you know exactly what to look for on your chart, and exactly how to trade it.
Putting It All Together
So let’s summarize what you’ve learned so far and put it into a step-by-step action plan for you to trade the Bull Flag Pattern:
Step 1: Look for the 20 EMA to cross above the 50 EMA and for the market to be trading above the 20 EMA.
Step 2: Look for the Bull Flag Pattern to form. Ideally, you want the formation of the flagpole to have fewer candlesticks compared to the flag.
Step 3: Wait for a bullish candlestick pattern to form on the 20 EMA.
Step 4: Once the bullish candlestick pattern is formed, see if there’s hidden divergence on the Stochastic Oscillator.
Step 5: If there’s hidden divergence, use one of the 3 entry methods to go Long. Then place your Stop Loss below the low of the bullish candlestick pattern. Place your Take Profit level at either 1.5R or 2R.
Now, let’s take a look at a chart example so you can see how it looks like:

In the chart above, you can see that the market is clearly in an uptrend.
The 20 EMA is above the 50 EMA, and the market is forming higher highs and higher lows.
On the first bounce of the 20 EMA, the market shot up and formed the Bull Flag’s flagpole in just three bars.
After that, the market started consolidating and moved sideways.
If you noticed, the bars are relatively smaller as well.
This is a sign that the market is preparing for a possible upwards move.
Just as the market touched the 20 EMA, it formed a Bullish Engulfing Candlestick.
At this point, you can see that the Stochastic Oscillator is indicating a hidden divergence with a lower low.
So this is a valid trade signal.
Here’s another trade example:

In the chart above, you can see the same thing happening as the previous trade example.
The 20 EMA is above the 50 EMA, and the market is trading well above the 20 EMA.
It then made a small pullback of two candlestick bars before going up again to form the flagpole.
Now, here’s a question for you:
Is the small pullback with two candlestick bars considered a Bull Flag Pattern?
The answer is yes.
But because it did not satisfy our criteria, we do not trade it.
As you start looking at your charts to identify Bull Flag Patterns, you will find that there are many of them forming all the time.
But we do not want to trade every single one of them.
We only select trades according to our trading setup rules.
So after the flagpole is formed, the market started to consolidate and pullback to the 20 EMA forming the flag.
And if you noticed, the flagpole has fewer candlestick bars then the flag itself.
Generally, the more candlestick bars there are forming the flag, the higher the probability of the pattern working out.
This is because the consolidation is like a coiled spring.
The more coils there are in the spring, the stronger the force of the bounce when you release it.
So similarly, the more candlestick bars there are in the flag pattern, the stronger the breakout can be.
Now, once the market touched the 20 EMA, it formed a Bullish Pin Bar.
At the same time, the Stochastic Oscillator is showing a clear indication of a hidden divergence.
This validates the Bullish Flag Pattern for us to enter a trade.
Conclusion
Now that you know exactly what to look out for on your chart when it comes to the Bullish Flag Pattern, you will start to realize that it actually forms very often.
However, you don’t want to make the mistakes of trading every single one of them.
Many traders get tempted to trade it every time it shows up thinking it will make them more profitable…
But they end up wiping out their trading account quickly.
If you see a Bull Flag Pattern on your chart but it doesn’t conform to the steps that I’ve given you, what do you do?
You give it a miss.
Remember, the market will give you many opportunities to trade this setup.
Furthermore, there are many different currency pairs you can trade it on.
So if you see a Bull Flag Pattern that doesn’t conform to our steps, give it a miss.
And don’t feel bad if the market starts going up after that.
Be patient and wait for the next opportunity.
With that said, there are many ways to trade the Bull Flag Pattern.
What I’ve shown you in this guide is just one way to trade it.
To be profitable, you do not need to learn every single way to trade the Bull Flag Pattern.
Stick to just one, and then master it.
That’s how many of the top traders earn their living in the markets.
One more thing…
Did you like this post?
If so, would you please share it?
Remember, sharing is caring, and it won’t even take 5 seconds of your time.
So go ahead, click the share button below now 
Leave a Reply