
Are you curious to know how prop traders trade?
Then you’ll want to know about Order Flow Trading because that’s what most prop firms teach their traders.
When I was a prop trader for 4+ years, all we were taught was Order Flow Trading.
We weren’t taught any bullish candlestick patterns or bearish candlestick patterns…
We also weren’t taught any chart patterns or reversal patterns…
And we definitely weren’t taught to use any indicators to trade the market.
All we were taught was to read Order Flow.
Although I’ve since stopped being a prop trader for some time now (because I’m already considered old to be a prop trader)…
I’d like to impart what I’ve learned over the years as a prop trader.
So if you’re interested in Order Flow Trading, or want to become a prop trader, then you’d want to pay attention to this post…
Because I’ll share with you everything I’ve learned about Order Flow Trading in my 4+ years as a prop trader.
What is Order Flow Trading?
Order Flow, as the name suggests, is essentially the transactions of the orders that are taking place in the market.
It can probably be considered price action in its purest form.
There are 4 pieces of information that traders use to read Order Flow:
- Size of the Bids and Offers.
- Market Profile (Total volume traded on each level).
- Transactions on the Inside Bid & Offer (Buy & Sell transactions at each level).
- Bids and Offers that got pulled.
Based on a combination of these 4 pieces of information, the trader will decide when and where to buy and sell.
The way that traders read these 4 pieces of information is through what’s called the Depth-of-Market (DOM):

On the left-hand side of this DOM shows the total volume transacted at that particular level.
This is called the market profile.
On the Inside Bid at 135, you can see that the volume transacted at that level is 28,930.
This means that 28,930 lots had so far transacted at this level for the day.
This is important to know because it will give you an idea as to how the market has traded when approaching these levels.
Levels that have relatively high volume transactions can be good support or resistance levels.
So how do you use this information to trade?
How to Use Order Flow to Trade Pullbacks
The first way to use Order Flow is to trade pullbacks.
Here’s how pullbacks look like when the market is in an uptrend:

Here’s how pullbacks look like when the market is in a downtrend:

To trade pullbacks successfully, you have to identify whether the market is trending or going sideways.
This is important because it is easy to get caught in whipsaws if the market is not trending in a particular direction.
To identify whether the market is trending, the first thing you want to do is to visually look at the chart.
In Order Flow Trading, you are not trading off the charts but rather understanding where price has been and where it could be headed.
So with a glance at the charts, you’d be able to quickly identify the general direction of the market.
In an uptrend, the market will form a wave-like pattern with higher lows and higher highs:

Similarly, in a downtrend the market will form wave-like patterns of lower lows with lower highs:

This is the basis for identifying an uptrend or downtrend.
In an uptrend, you want to see the Order Flow on the DOM coming in with strong buying…
And have Bids come in to confirm buyers willing to come in to push the market higher.
In a downtrend, it is the exact opposite.
When this happens, we now look for a potential level to enter into a pullback trade.
The 4 Steps To Trade A Pullback Using Order Flow
Step 1: Identify that the market has started to trend in one direction with strong buying or selling pressure in the direction of the trend.
For example, if the market is in an uptrend, you want to see some strong buying with the Offer giving way relatively easily.
Step 2: Identify potential levels to enter a trade.
Ideally, you want levels where the market profile shows a relatively large volume because there’s a high chance that the market will turn at those levels.

In the DOM above, you can see that the market has traded down to 126’295/126’300.
Here’s a question for you:
If the market pulls back up, where do you think would be a good level to enter a Short trade just purely based on the market profile? (Think of an answer before reading on.)
If you have said 126’310 and 126’315, then you’re on the right track.
That’s because, at those levels, the volume traded is relatively higher than other levels.

This signifies that there could be selling pressure if the market were to reach those levels again.
So chances are if the market were to pullback to those levels, it would trade back down again.
Now, what if instead of the DOM above, you see this DOM below:

If you noticed, there are no levels with a significantly higher volume traded.
So what do you do in this case?
You identify potential levels based on the Order Flow action you see.
Generally, when the market retraces 2 – 4 ticks, you want to look for a sign of sellers coming in to push the market back down.
Sometimes when there aren’t any strong levels or signs of strong selling, you want to give this trade a miss as it might be a low probability trade.
Remember that this kind of setup can happen many times in a day.
So it is okay if you miss a couple of these trades.
You only want to pick the best trades where the Order Flow conforms with the direction of your trade.
Step 3: Wait for the market to make a pullback and wait for the Order Flow to confirm an entry.
For example, if you’re planning to go Long, you want to look out for absorption on the Bid or a slowing of selling pressure.
Step 4: Once the Order Flow conforms with the direction of your trade setup, then you enter the trade.
So for example, if you want to go Long and you see strength on the Bid, you can either queue on the Inside Bid, or lift the Offer to go Long.
Let’s take a look at an example:

On the left-hand side of the image above, you can see that the market is trending up.
Based on the market profile you can see that 105 and 100 are two potential entry levels because it shows there was high volume traded there.

So what you want to do is wait for the market to make a pullback to these two price levels.
In the DOM above, you can see that it is now 105 Bid / 110 Offer.
However, you don’t want to enter into a trade yet.
Instead, you want to wait for the Order Flow to confirm that 105 would be a good place to go Long.
To go Long, you want to look for either strength on the Bid or weakness in selling into the Bid as the market got to 105 or 110.

In the DOM above, you can see that 105 has started to get hit and there were 581 lots transacted on the Bid.
At this point, although 105 Bid was much smaller than the 110 Offer, it did not turn Offer.
That was a sign that there wasn’t a huge seller coming in to push the market lower.
Also if you noticed, the Bids below 105 are pretty thick.
This is an additional clue that the market might be holding at those levels.

Shortly after, 105 became Offer but the size was small.
At this point, 100 Bid did not get hit at all.
There was also a pause at 100 Bid and 105 Offer.
Then after the short pause, someone lifted the Offer at 105 for 66 lots.
This is the sign to go Long and I lifted the Offer at 105.

A few moments later, a huge buyer came and swept the whole Offer at 110 and it immediately became a huge Bid.
This is a good sign as it clearly showed strong buying.
This was what I mentioned earlier that I saw that 105 Bid did not get swept as the market was going lower.
More often than not, when a level gets swept, it indicates a huge buyer or seller who wants to push the market.
And since I’m Long, this gave me the conviction to hold the trade a little longer.
When you’re Long or Short, you want to see big buying or selling coming in to sweep the levels in the direction of your trade.
If you’re spot on in your Order Flow read, the market generally shouldn’t go against you by more than 2 – 3 ticks.
In this example, the market didn’t even go 1 tick against me and went up immediately.
This is what you want to see in your trades as well.

As much as I would like to hold this trade for a big move, unfortunately, the market went up 3 ticks to 120 and seemed to have lost momentum.
There was quite a bit of selling pressure there with the Offer coming back each time it became Bid.
And so I decided to get out for a 3 tick profit.
So there you go.
That is how you enter into a pullback trade and this scenario will happen many times in a day so there are plenty of opportunities to take such trades.
How to Use Order Flow to Trade Reversals
The next way to use Order Flow is to trade reversals.
Trading reversals can be very lucrative if traded right…
However, reversals aren’t exactly that easy to trade because you are essentially going against the trend.
If you fade a trend wrongly thinking it is a reversal, then you could incur a big loss if you don’t cut your trade quickly.
While it may be scary trading a reversal because you are trading against the general flow of the market…
There is a safe way of doing it by identifying good reversal levels through Order Flow.
While a reversal simply implies a change in the direction of the market, there are two different kinds of reversals that occur when trading the market.
1) Reversal At The End of A Trend

The first type of reversal happens right at the very end of the trend and can sometimes reverse the whole move.
To catch this reversal, you will have to be very patient and be spot on with your Order Flow reads.
However, if you are wrong on your read, it could go further against you.
2) Reversal In A Sideways Market

The second type of reversal occurs much more often because the market is constantly bouncing back and forth in a range.
Since the market is in a range, there will be more chances to catch such a reversal.
However, the move will not be as big as the first type of reversal.
So which reversal do you want to trade?
The answer is both…
But it is important to identify the type of reversal trade that is happening.
In my experience, it is much easier to trade reversals when the market is ranging because it is less risky if you are wrong.
As the market is going sideways, it might only go against you by a few ticks if you’re wrong.
But if you try to trade a reversal at the end of a strong trend and you are wrong, it could go against you by quite a bit.
Also, especially if you are new to reading Order Flow, trading reversals at the end of a trend can be tough and tricky.
So if a market is trending, it’s much better to trade pullbacks with the trend rather than reversals.
Okay, let’s take a look at how to trade reversals in a trending market.
Trading Reversals At The End of A Trend
Step 1: The first step is to identify if the market is trending.
If you recall, the market is considered in an uptrend if it forms higher highs and higher lows.
And it is considered in a downtrend if it forms lower lows and lower highs.
Step 2: Go to ForexFactory.com to see if there is any news that has just been released or about to be released that fueled this move.
This is important because if the move was caused by a news event, then you do not want to trade reversals as the market can easily go against you by a lot if you’re wrong.
Step 3: If there is no news, the next step is to identify levels that could be possible reversal levels.
For this, look at the DOM.
What you want to identify are places where the market profile shows more volume than other levels.
Step 4: Wait patiently for the market to revisit this level and then watch the Order Flow if it gets there.

If the market does not revisit this level and starts reversing, then there’s no trade.
Step 5: If the market revisits the level, watch the Order Flow action and the market profile at that level.
At that level, you don’t want to place an order just because it previously bounced off the 126’305 level.
It’s possible that this could just be a continuation of a trend rather than a reversal.

At this level, you want to look at the Order Flow of 2 levels – 126’305 & 126’300.
Either of these two levels can be your entry.
Your Stop Loss will be placed just 2 -3 ticks below giving a good risk-to-reward ratio on such trades.
Also, you mustn’t immediately place an order at 126’305 or 126’300 just because the market bounced off these levels once.
You want to see evidence of buyers coming in to support this level in the order flow before being convinced that these levels can hold.
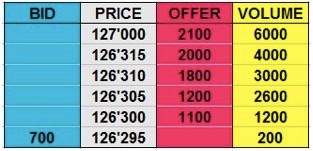
Here’s how the DOM looks like when price visits the 126’305 level the second time:

To go Long, you want to see strength on the 126’305 Bid.
A good sign of strength would be if 126’305 can’t go Offer, or that once it goes Offer it quickly becomes Bid again.
Here’s what you want to see:

You can see that at 126’305, the volume went from 2000 to 3800.
This means that although there were only 700 lots shown on the Bid initially, 1800 lots got traded.
This shows that buyers are stepping in at this level and it’s a good sign of strength.
Furthermore at 126’300, the volume only went from 800 to 900.
So that means that only 100 lots got hit on the Bid at 126’300 before the buyers came in to turn 126’305 Bid again.
At this point, you want to either place your order at 126’305 Bid or lift the Offer at 126’310 if the Offer is about to go.
Sometimes, you can also see more signs of bullishness when Bidders come in with size at the level below the inside Bid:

More often than not, when you see a sudden increase in size one level away from the inside Bid or Offer…
And the market starts going up a couple of ticks…
The big order size will suddenly disappear.
This is called Spoofing.
It’s when traders show a big size on the order book to let the market believe there will be strong buying or selling pressure when it reaches that level.
This can be seen as deliberate manipulation.
And the reason some traders do that is because if they are in a position, they want to let the market either support their position or get out of their way.
So for example, if the trader has a Long position, he might Spoof the lower Bids and also pull all his Offers.
This way the market will seem very bullish and invite other traders to join him in his position.
Why It’s Important To Look At Order Flow
Let’s say for example, instead of seeing the above order flow action, you see this instead:
You can see that at 126’305, the volume only went from 2000 to 2600.
And at 126’300 the volume only went from 800 to 1200.
This meant that at 126’305 there were only 600 lots traded and at 126’300 there were only 400 lots traded.
This shows that the majority of the orders on the Bids were pulled.
And that meant that there weren’t really any signs of strength.
No buyers were willing to scoop up the prices at 126’305 and 126’300.
If you had initially placed an order at 126’305 without first seeing the order flow, you will now be down by 1-2 ticks.
This is why it’s important to see the order flow first before executing your trades.
So we start by forming a hypothesis in our head.
In our case, we are looking at the level at 126’305 and 126’300 for a possible Long.
So we say that if there are signs of strength then we will go Long.
Then we wait for the market to get to these levels, and we use Order Flow to confirm our hypothesis.
Once our hypothesis has been confirmed, then we can enter a trade.
Beware of Consolidation
Okay, so let’s say for example the Order Dlow shows strength at 126’305 and we go Long.
But instead of the market going straight up, it bounces back and forth around 126’300 to 126’310.
Instead of seeing continued strength of buying at 126’310, the market keeps turning Offer at 126’310…
Then trades back down to 126’300…
And goes back up to 126’310 again.
Here’s how the DOM looks like now:

We can see that at 126’310 and 126’315, the volume has increased.
This shows that sellers are coming in at these two levels making the market bounce between 126’300 and 126’315.
At this point, I would suggest to either scratch your trade or take 1 tick profit/loss.
This is because it could be a sign that the trend is about to continue and might go further down.
When the market consolidates for some time like this, chances are that there will be a breakout.
But we can’t tell which way the market will break out, so it’s best to get out of our trade.
Trading Reversals in A Sideways Market
Trading reversals in a ranging market is very similar to trading reversals in a trending market.
The only difference is that in a trending market you can expect to make more profits.
While in a sideways market you would probably only take a couple of ticks.
Some people avoid ranging markets altogether while some people exclusively trade ranging markets.
Ultimately it is up to you.
Recap on Trading Reversals
Step 1: Identify the general market direction.
Is it trending or going sideways?
Step 2: Go to ForexFactory.com to see if there are any Medium to High Impact news coming up.
Step 3: Identify levels to enter.
Step 4: Wait for the market to revisit these levels.
Step 5: See the Order Flow for confirmation.
If the Order Flow confirms that your levels can hold, then enter the trade.
That’s it.
One more thing…
Did you like this post?
If so, would you please share it?
Remember, sharing is caring, and it won’t even take 5 seconds of your time.
So go ahead, click the share button below now 
Thanks for this article Davis, learned a lot!