
Want a way to identify turning points in the market with a high probability of success?
Then you want to know how to identify divergence.
The most common divergence that traders use is called regular divergence.
That’s mainly used to identify reversals in the market.
But there is another type of divergence called hidden divergence.
Hidden divergence can help you identify pullbacks that have a high probability of working out.
However, there’s a more advanced way to use hidden divergence in your trading…
And that is to use it to trade reversals.
In this post, I’ll solely be focusing on hidden divergence.
I’ll not only show you exactly how to identify it…
But I’ll also show you exactly how to trade it the right way.
So that by the end of this post, you will know everything there is to know about hidden divergence…
And how to use it to trade the markets with high accuracy.
Let’s get started.
What is Hidden Divergence
So before I get into hidden divergence, you need to know what is regular divergence as well…
And the difference between the two.
So, as mentioned, here are two types of divergences – regular divergence and hidden divergence.
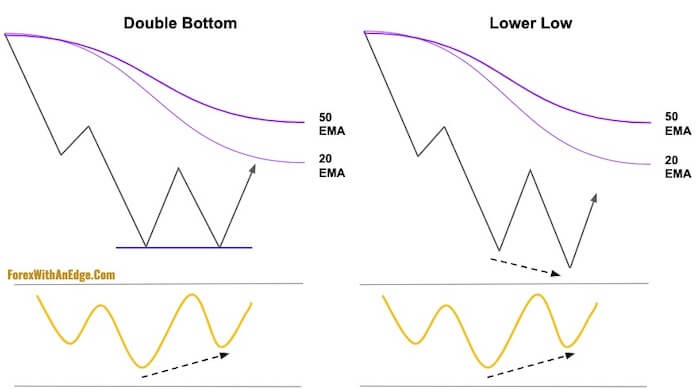
Regular divergence is mainly used to trade reversals patterns like Double Bottoms and Double Tops.
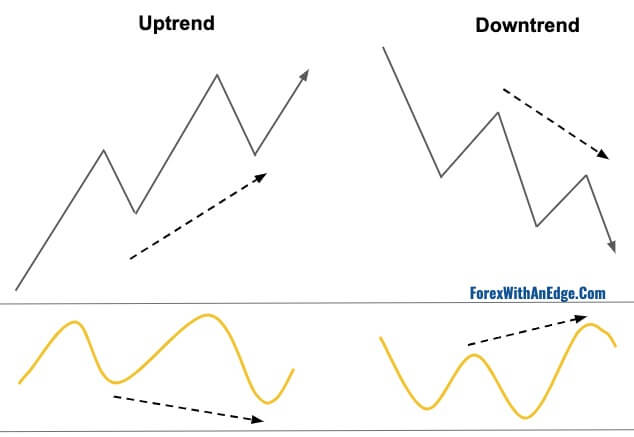
Here’s a cheat sheet on how regular divergence looks like:

In a downtrend, a regular divergence is when the market is making lower lows but the indicator is showing a higher low.
In an uptrend, a regular divergence is when the market is making higher highs but the indicator is showing a lower high.
As you can see, regular divergences are quite easy to spot.
With hidden divergence, it’s not as obvious to spot.
But once you get the hang of it, you will be able to find it with ease.
For hidden divergence, it is mainly used to identify pullbacks that have a good chance of working out.
The diagram below shows two pullbacks in an uptrend.

In the diagram above, you can see the difference between pullbacks that don’t have hidden divergence and pullbacks that have hidden divergence.
When there is no hidden divergence, both the market and the indicator will be moving pretty much in tandem.
On the left-hand side of the diagram, you can see that the market is making a higher low and the indicator is also making a higher low.
There is no hidden divergence there.
But on the right-hand side of the diagram, the market is also making a higher low, but the indicator is showing a lower low.
This is called a hidden divergence.
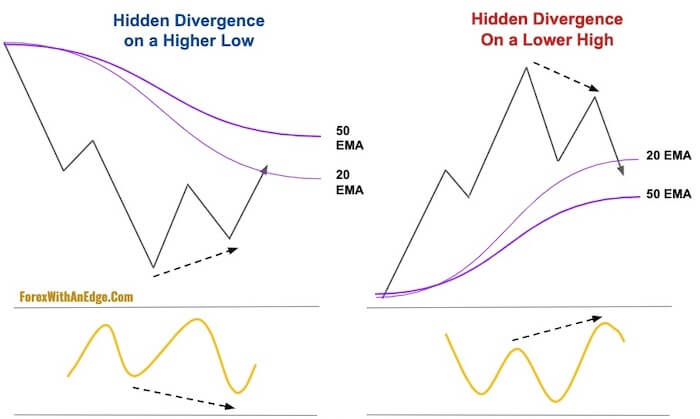
Here’s the cheat sheet on how hidden divergence looks like for both an uptrend and a downtrend:

In an uptrend, there is a hidden divergence when the market is making a higher low but the indicator is making a lower low.
And in a downtrend, there is a hidden divergence when the market is making a lower high but the indicator is making a higher high.
Now that you know how to spot hidden divergences in the market, what indicators should you be using to spot them?
How to Identify Hidden Divergence Using Indicators
To identify hidden divergence, we use indicators.
There are 4 common types of indicators that can identify hidden divergence:
- Relative Strength Index
- Moving Average Convergence Divergence
- On Balance Volume
- Stochastic Oscillator
While there are other indicators that can also identify hidden divergence, these four are the most common ones that work well.
Relative Strength Index (RSI)
The first indicator that can help to identify hidden divergence is the RSI indicator.
The most common use for the RSI is to identify overbought and oversold conditions in the market.
The diagram below shows the RSI on my charting platform, TradingView:

When the reading is above 70, it’s considered overbought and it’s an indication that the market might start going down.
And when the reading is below 30, it’s considered oversold and it’s an indication that the market might start going up.

In the chart above, you can see that the different turning points of the market coincide with the RSI being overbought and oversold.
So in this case, if you had gone Long whenever the RSI is indicating the market is oversold, and gone Short whenever the RIS is indicating the market is overbought…
You would be profitable three times in a row.
This is how many traders use the RSI to trade the market.
However, it can be misleading because when the market is trending in either direction…
An overbought signal can be more overbought as the market trends upward.
And an oversold signal can be more oversold as the market trends downward.
A better way to use RSI, in my opinion, is to use it to identify divergence in the market.
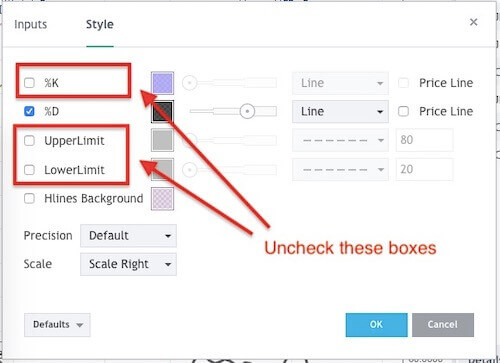
To identify divergence using the RSI, what I like to do is uncheck the following boxes to see the RSI lines more clearly:

Once you’ve unchecked the boxes, it will only show the RSI signal line and this will allow you to identify divergences more easily:

In the chart above, you can see that I’ve identified three regular divergences.
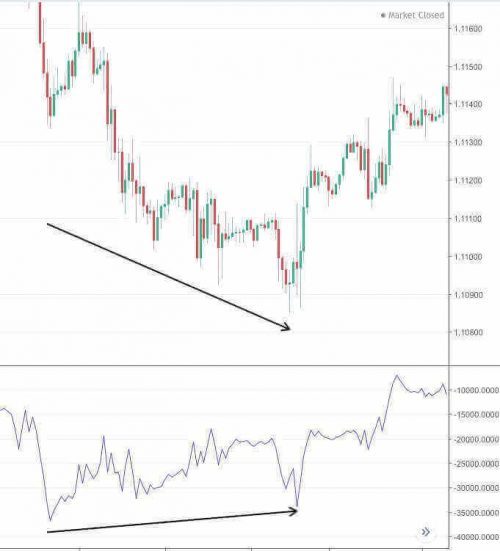
The first divergence on the left-hand side is where the market is making a higher high but the RSI is showing a lower high.
The second divergence in the middle is where the market is making a lower low, but the RSI is showing a higher low.
And the third divergence on the right-hand side of the chart is where the market is making a higher high, but the RSI is showing a lower high.
Moving Average Convergence Divergence (MACD)
The next indicator that can identify divergences is the MACD.
To identify divergence on the MACD is similar.
We use the two lines on the MACD to identify whether there is a divergence.
Some traders use the histogram to identify the divergence.
Here’s the same chart we used in the RSI example:

As you can see, it produced the same divergence signals as the RSI.
On Balance Volume (OBV)
Another way to identify divergences in the market is by using the OBV indicator.
OBV is a momentum indicator.
However, it’s not a very common indicator that traders use in the Forex Market as it’s originally designed for the Stock Market.
Its creator, Joseph Granville, designed the indicator to track the change in volume from day to day to predict a major move in the market.
He believes that when there is a sudden increase in volume when the stock’s price has not moved much, it’s an indication that the market might start rapidly move up or down.
However, in the Forex Market, using volume is not exactly accurate because there’s no centralized exchange to track all the market’s volume in one place.
That means each broker is only showing the volume based on their own clients’ transactions, not the volume of the entire market.
Therefore it can be misleading because two different brokers can have two very different volumes transacted based on their own client base.
However, it can be a useful indicator to identify divergence.
While it may not produce as many signals as compared to other indicators, it can be pretty accurate when a signal comes.

Using the same chart as with the previous two indicators, you can see that with the OBV indicator, it doesn’t produce any divergence signal.
But in the chart below, it shows divergence over a longer period of movement:
So if you don’t mind having fewer divergence signals, then you can consider using the OBV indicator.
Stochastic Oscillator
The last indicator that you can use to identify divergence in the market is the Stochastic Oscillator.
The Stochastic Oscillator is similar to the RSI in the sense where it tracks overbought and oversold conditions in the market.
When it goes above 80, it’s considered overbought.
And when it goes below 20, it’s considered oversold.
The way many traders trade this is when the two lines cross each other, they consider it a signal to either buy or sell.

But similar to the RSI, an overbought or oversold reading would be useless in a trending environment.
As such, I only use the Stochastic Oscillator to identify divergences in the market.
To identify divergence with the Stochastic Oscillator, we want to remove the overbought and oversold lines, and only leave the %D line like this:
When you do that, it leaves just one line and makes it easier to identify divergence in the market.
Using the same chart as before, you can see that it produces slightly different signals than the other indicators:

If you compared all the four indicators, you will notice that the Stochastic Oscillator gives a clearer signal when divergence occurs.
And in this chart above, you can see that it has slightly more frequent divergence signals than the other indicators.
So how do you decide which indicator to use?
It comes down to your testing and personal preference.
My preference is to use the Stochastic Oscillator because it’s the very first indicator I’ve learned to use when I started trading over a decade ago.
Also, with the Stochastic Oscillator, the divergence is much clearer when it happens.
So for the rest of this post, I will be using it for all my examples.
And I’ll be using the following settings:

Now, if you’re wondering whether there is a “best” setting.
The answer is no.
Certain settings give more frequent divergence signals, and some give lesser signals.
This setting above is what I’m comfortable using and it smooths the line as well, making it easier to identify divergences in the market.
So how do you trade hidden divergence in the market?
There are two ways:
- Trading Pullbacks
- Trading Reversals
Let’s get into the details of each of them.
Using Hidden Divergence to Trade Pullbacks
The first way to trade hidden divergence is with pullbacks (or retracement).
In an uptrend, the market will form a wave pattern consisting of higher highs and higher lows:

These “higher lows” are the pullbacks in an uptrend.
In a downtrend, the market will form a wave pattern consisting of lower lows and lower highs:

These “lower highs” are the pullbacks in a downtrend.
Now, these pullbacks occur very often in the market.
But we do not want to trade every pullback that happens.
Instead, we only want to trade the pullbacks that have a hidden divergence.
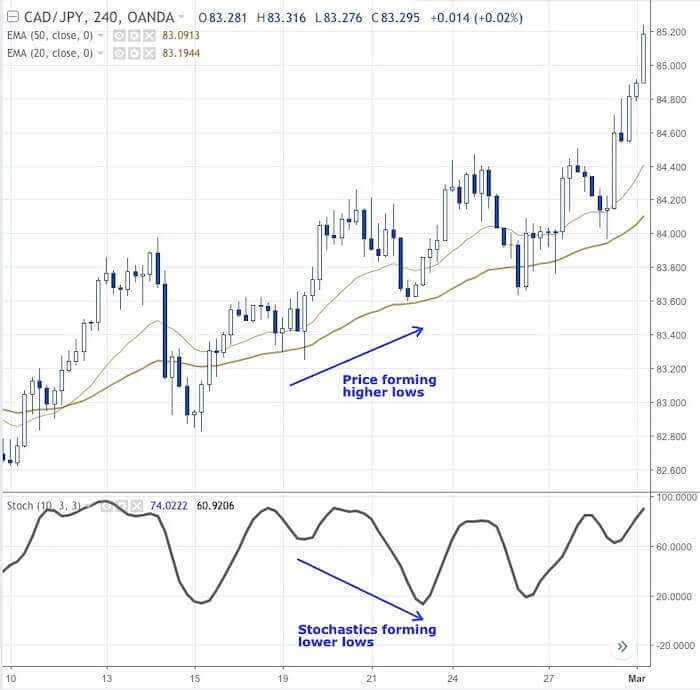
So in an uptrend, a hidden divergence occurs when the market is forming higher lows but the Stochastic Oscillator is forming lower low.
And in a downtrend, a hidden divergence occurs when the market is forming lower highs but the Stochastic Oscillator is forming higher highs.
The diagram below is what you want to be looking for when you trade the markets:
Now, what I additionally like to do when identifying hidden divergence is to add two Exponential Moving Averages (EMA):
- 20 EMA
- 50 EMA
To enter into a hidden divergence trade, I’m looking for the market to bounce off either of the two EMAs…
Or for the market to move below either of the two EMAs, then close above the 20 EMA in an uptrend…
Or for the market to move above either of the two EMAs, then close below the 20 EMA in a downtrend.
Let’s take a look at a few trade examples to illustrate what I mean.
Hidden Divergence Pullback Trade Examples
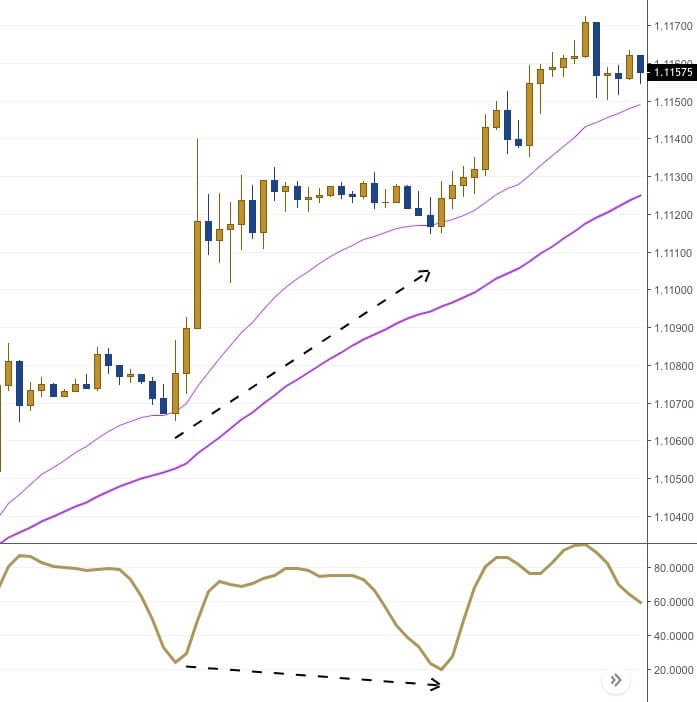
In the chart above, you can see that the market is in an uptrend and forming higher highs and higher lows.
It has also bounced off the 20 EMA twice.
On the first bounce, there was no hidden divergence so there’s no trade signal.
But on the second bounce, the Stochastic Oscillator has formed a lower low indicating a hidden divergence.
To enter into this trade, there are 3 ways:
- Go Long at the close of the Bullish Engulfing candlestick that formed on the 20 EMA (which is a bullish candlestick pattern).
- Go Long at the break of the high of the Bullish Engulfing candlestick.
- Go Long at a close above the Bullish Engulfing candlestick.
If you chose the first way, you would have gone Long at 1.1125.
If you chose the second way, you would have gone Long at 1.1130.
And if you chose the third way, you would have gone Long at 1.1130 as well.
For all three ways, place the Stop Loss is below the low of the candlestick.
Here’s another trade example:

On the left-hand side of the chart above, you can see that the market has just transitioned from an uptrend into a downtrend where the 20 EMA crossed below the 50 EMA.
Then the market started to form lower lows and lower highs.
At the lower high where the hidden divergence was formed, the market went above both the EMAs.
Stochastic divergence showed a higher high indicating a hidden divergence.
Then the market came back down to close below the 20 EMA.
This is our signal to go Short.
This is what I meant earlier when I mentioned that I’m looking for the market to move above the EMAs and then close below the 20 EMA.
To get into a Short trade, there are two ways:
- Wait for the market to close below the 20 EMA, then go Short at the close.
- Wait for the market to close below the 20 EMA, then place a Sell Limit Order above the close.
For both ways, the Stop Loss is placed above the swing high.
Let’s take a look at one more example:
In the chart above, you can see where the hidden divergence was formed…
The market didn’t exactly bounce off either of the two EMAs.
Instead, it moved below the 20 EMA but did not touch the 50 EMA.
In this case, the entry trigger to go Long is simply a close above the 20 EMA.
So once the market closes above the 20 EMA, you can either go Long at the close…
Or place a Buy Limit Order below the close.
Now, what I’ve shown you with these three trade examples is the most common way to trade hidden divergences.
There’s one more way to trade hidden divergences and that is to use it with reversals.
Using Hidden Divergence to Trade Reversals
When it comes to reversals, the most common way that traders identify divergence is with regular divergence.
That means in a downtrend, traders are looking for the market to form either a Double Bottom or a lower low, and for the indicator to form a higher low like this:
And in an uptrend, traders are looking for the market to form either a Double Top or a higher high, and for the indicator to form a lower high like this:

But what happens if the market forms a higher low in a downtrend or a lower high in an uptrend?
In both cases, regular divergence won’t work.
Instead, we look for hidden divergence.
So here’s what you want to look out for in the market with these two patterns:
You can see that it’s a very similar pattern as to trading pullbacks.
The difference is that this is a countertrend trade, whereas pullbacks are trend trades.
Let’s take a look at a few trade examples so you can see how it looks like on the charts:

In the chart above, you can see that the market has been in a downtrend from the left-hand side of the chart.
In this hidden divergence, you can see that the market made a higher low…
But the Stochastic Oscillator made a lower low.
To go Long, simply wait for the market to close above the 20 EMA.
If you are more conservative, you can wait for a close above the 50 EMA before going Long.
And if you like to have a better entry…
Instead of entering at the close above the EMAs, place a Buy Limit Order below it.
In this case, the market closed above 20 EMAs at around 111.10.
Instead of going Long there, you can place a Buy Limit Order at the nearest 5-pips interval level below it at 111.05 or 111.00.
If you placed a Buy Limit Order at 111.05, you would have been filled only much later…
But you would have gotten a very good entry as that’s the lowest point the market went down to before going up.
But if you placed your Buy Limit Order at 111.00, you would have missed the trade.
However, even if you have missed the trade, it doesn’t matter because there are still many more opportunities in the market.
The last thing you want to do is to chase the market.
Let’s look at another trade example:
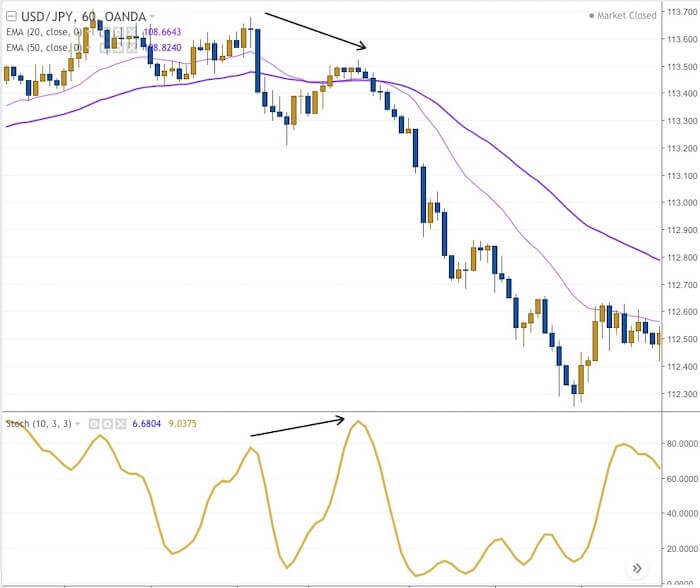
In the chart above, you can see on the left-hand side that the market had been in an uptrend.
The market then dipped below the two EMAs indicating that the trend is getting weaker, and then it came back up above both of it to form a lower high.
At this point, the Stochastic Oscillator is showing a higher high indicating a hidden divergence.
For this trade, you can see that when the market came back down again to close below both EMAs, it’s a transition from an uptrend to a downtrend.
If you entered this trade, you would have gotten in right at the turning point.
To go Short, simply wait for the market to close below the 20 EMA.
Then place Stop Loss above the swing high.
Because the candlesticks are relatively small in size, you can have a very tight Stop Loss of around 15 – 20 pips.
If you use a Trailing Stop Loss, you’d be able to get a very nice profit on this trade.
Let’s took a look at one more example:

The chart above is generally in a downtrend as you can see from the left-hand side of the chart.
It has been trading below the 20 EMA and in one candlestick bar, it moved above both EMAs and closed above it.
The big candlestick is because there was a news release then.
After that, the market traded above both EMAs for some time and formed a lower high.
At the lower high, the Stochastic Oscillator is showing a higher high indicating a hidden divergence.
Similarly, to go Short, wait for the market to close below the 20 EMA.
In this case, the candlestick that closed below the 20 EMA also closed below the 50 EMA.
From there, the market started to continue in its downtrend.
Conclusion
So here’s a summary of what you have learned in this post:
- A hidden divergence can happen both in an uptrend and a downtrend.
- You can use hidden divergence to trade both pullbacks and reversals.
- To identify a hidden divergence for a pullback in an uptrend, the market has to form a higher low while the Stochastic Oscillator has to form a lower low.
- And to identify a hidden divergence for a pullback in a downtrend, the market has to form a lower high while the Stochastic Oscillator has to form a higher high.
- For a reversal in an uptrend, the market has to form a lower high while the Stochastic Oscillator has to form a higher high.
- And for a reversal in a downtrend, the market has to form a higher low while the Stochastic Oscillator has to form a lower low.
- To enter into a Long trade, we wait for the market to close above the 20 EMA.
- And to enter into a Short trade, we wait for the market to close below the 20 EMA.
Now that you know exactly how to identify a hidden divergence…
It’s time for you to put it into practice and start finding them on your charts.
What I’d like to know from you now is did this post help you become better at identifying hidden divergences?
Let me know in the comments below.
One more thing…
Did you like this post?
If so, would you please share it?
Remember, sharing is caring, and it won’t even take 5 seconds of your time.
So go ahead, click the share button below now 
This is very helpfull