
Traders are swamped with a plethora of trading indicators available to them.
And this creates a huge dilemma in many new traders.
They ask questions like:
“What are the best indicators to trade trends?”
“What are the best indicators to trade reversals?”
“How many indicators do I need?”
“What is the best combination of indicators?”
“Is this indicator better than that indicator?”
And this is where the problem lies.
They are focused on how indicators can help them get into a trade.
Indicators are all lagging.
That means they only form after the price has moved.
When I was working in a prop firm several years ago, no one used indicators to get into trades.
But rather, we use indicators to give us an idea of how to read the markets.
And from there, we make our trading decision to enter into a trade or not.
So instead, you should be asking the right question, and that is:
“Which indicators can I use to help me read price action better?”
And that’s what I will focus on in this post.
In this post, I will share with you the 3 indicators I use to help me identify trends and reversals in the markets.
The 3 Indicators to Identify Trends & Reversals
Here are the 3 indicators that I have on my charts all the time:
- 20 Exponential Moving Average
- 50 Exponential Moving Average
- Stochastic Indicator
There are many different ways traders use the Exponential Moving Average (EMA).
One of the common ways is to use it as a trade entry when the EMAs cross each other in hopes to catch a trend.
For example, when the lower period EMA crosses above the higher period EMA, traders get into a Long trade.
And when the lower period EMA crosses below the higher period EMA, traders get into a Short trade.
Now, this can surely work when the markets are trending.
However, markets only trend less than 30% of the time.
The rest of the time, the markets are moving sideways.
And this will lead to a whipsaw situation on the EMAs where they will keep crossing each other.
So you definitely do not want to get into a trade just because your indicators say so.
The way I use the EMAs is to simply give me an idea of whether the market is in an uptrend, a downtrend, or moving sideways.
And this is an indication to me on what kinds of trades to look for.
For example, if the 20 EMA is above the 50 EMA, then I’m looking either for a pullback trade to go Long, or a reversal trade to go Short.
And if the 20 EMA is below the 50 EMA, then I’m looking either for a pullback trade to go Short, or a reversal trade to go Long.
And if the EMAs are constantly crossing each other, then I’m looking to fade swing highs and lows.
Trading With the Trend
If you’ve been trading long enough, I’m sure you’ve heard of this overused phrase that “the trend is your friend”.
But how do you identify a trend in the first place?
And how do you get into a trade when the trend has formed?
So here’s the thing about trends…
There is no way to know when a trend is forming until it has formed.
And to trade with the trend means that a trend has to already been formed before you can enter the trade.
The question traders are always battling with when entering a trend trade, is whether the trend will continue.
So how do you trade with the trend?
There are only two ways to trade with the trend.
The first way is to enter into a trade when the market goes higher in an uptrend or lower in a downtrend.
For example, trend traders like to get into a trade when the market break highs.
This could be simply entering into a trade when the market breaks a previous swing high or low…
Or using an indicator like the Donchian Channel to go Long when the market breaks above the upper channel, and go Short when it breaks below the lower channel.
The second way is to enter a trade during pullbacks (or retracements).
This is my preferred way of trading trends.
Here’s how pullbacks look like in an uptrend:

Here’s how pullbacks look like in a downtrend:

Now, while it can seem very easy to trade pullbacks, a pullback can very easily turn into a reversal.
Take a look at this chart below:

As you can see, the market is in an uptrend forming higher highs and higher lows.
The 20 EMA is above the 50 EMA as well so it shows the market is in a nice uptrend.
On the right-hand side of the chart, you can see that the market has gone down to the 20 EMA and formed a Bullish Pin Bar.
So this would seem like a very viable setup for going Long as a pullback trade.
Seeing this, you might decide to go Long at the break of the high of the Bullish Pin Bar.
And then you might place your Stop Loss just beneath the low of the candlestick, and your Take Profit level at the previous swing high.

However, if you had taken the trade, you would be stopped out.
After the Bullish Pin Bar was formed, the market only went up a little bit and started to reverse back down to hit the Stop Loss.
Now, of course, we all know that we will not win every trade.
But you certainly don’t want to be trading every pullback that forms a bullish candlestick pattern.
You will lose money in the long run.
Instead, you want to be selective and choose only the ones that have a high probability of it working out.
So how do you know which pullback would have a high probability of it working out?
That’s where my third indicator comes in…
And that’s the stochastic indicator.
Investopedia calls the stochastic indicator:

Now, I definitely will not go that far in saying that.
And I definitely do not use it as a buy or sell indicator.
But what it does well in is identifying trends and reversals when used the right way.
This is how it looks like on Trading View:
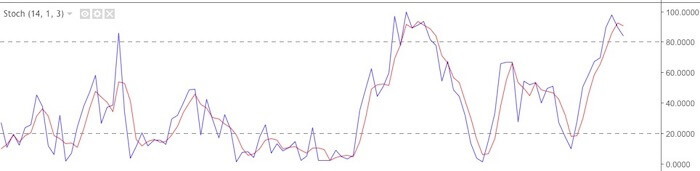
If you’re unfamiliar with what a stochastic indicator is, it’s widely used as an overbought and oversold indicator.
For example, if the stochastic is above 80, it is indicating that the market is overbought.
And when the stochastic is below 20, it is indicating that the market is oversold.
How most traders use the stochastic indicator is when the lines go above 80 and come back down below it, they go Short.
And when the lines go below 20 and go back up above it, they go Long.

However, this method won’t work when the market is trending strongly.

In the chart above, the market is trending very steadily upwards.
You can see that if you went Short each time there was a sell signal on the stochastic indicator, you would have been stopped out each time.
The overbought and oversold area becomes unreliable when the market is trending strongly.
So how do you use the stochastic indicator to identify whether a pullback has a high probability of working out or not?
Using the Stochastic Indicator to Identify Pullbacks
So first of all, I use the following settings on the stochastic indicator:

And I only use %D and uncheck %K and the overbought (UpperLimit) and oversold (LowerLimit) area:

The way I use the stochastic indicator is to look for divergence against the price.
More specifically, I look for hidden divergence when it comes to identifying high probability pullbacks.
Here’s what a hidden divergence is:
In an uptrend when the market is making higher lows, the stochastic indicator is making lower lows:
In a downtrend when the market is making lower highs, the stochastic indicator is making higher highs:

So what I look out for are the pullbacks that have hidden divergence on the stochastic indicator.
While there are many pullbacks in a trend, I only choose to trade those that have the hidden divergence.
This will give me an increased odds of the trade working out.
Trading Reversals
“Do I have to wait for the market to trend before I get into a trade?”
The answer is no.
And that’s where reversals come in.
Reversals are the opposite of trend trading because it is trading against the trend.
Yes, it can be tricky to trade against the trend…
But if you identify the right way to trade reversals, you can get into the very beginning of a trend trade because that’s what reversal are…
It’s identifying the turning point of a current trend before it transitions into a new trend in the opposite direction.
Again, there are many different ways to trade reversals.
There is no ONE way that is better than another.
It all comes down to finding a strategy that fits you.
The way I use these 3 indicators to trade reversals is by first finding bullish reversal chart patterns on the chart, and then using these indicators to decide whether to enter into a trade or not.
There are two types of reversals that I look for:
- Reversals in a Downtrend
- Reversals in an Uptrend
Reversals in a Downtrend
To identify reversals in a downtrend, I want to see that the 20 EMA is below the 50 EMA.
So even if the market is in a downtrend, I can still go Long or Short depending on the formation formed.
To go Long, I look for a double bottom or a lower low.
Here’s a double bottom in a downtrend:

Here’s a lower low in a downtrend:

However, we only want a lower low that is not too far off from the previous low.
This can be a little subjective, I know…
But it’s something you see with your eyes based on the charts and not easily explained in words.
The idea here is that you want the lower low to have a low that is shorter than the distance of the other previous lows.
I will get into a few chart examples below so you can see what I mean.
Next, to go Short, I will look for either a double top or a higher high.
Here’s a double top in a downtrend:

Here’s a higher high in a downtrend:

Similarly, for the higher high, we don’t want the second high to be too far off from the previous high.
Now, to determine whether we get into a trade using one of the formations above, this is where the stochastic indicator comes in.
On the stochastic indicator, I want to see if there’s divergence.
This is different from the divergence for identifying pullbacks.
For identifying pullbacks to trade, we use hidden divergence.
For identifying reversals, we use regular divergence.
To go Long, we are looking for either a double bottom or for the market to form lower lows, but the stochastic indicator is showing a higher low.
To go Short, we are looking for either a double top or for the market to form higher highs, but the stochastic indicator is showing a lower high.
Let’s take a look at a few chart examples.
Chart Examples
Double Bottom on a Downtrend with Divergence

Lower Low on a Downtrend with Divergence

Double Top on a Downtrend with Divergence

Higher High on a Downtrend with Divergence:

Reversals in an Uptrend
Trading reversals in an uptrend is the exact opposite of trading reversals in a downtrend.
So in an uptrend, we are looking for either a double top to go Short:

Or a higher high to go Short:

And we are looking for either a double bottom to go Long:

Or a lower low to go Long:

Ideally, I like for the double bottoms and lower low to be below the EMAs.
Let’s take a look at a few examples to illustrate what I mean.
Chart Examples
Double Top on an Uptrend with Divergence

Higher High on an Uptrend with Divergence

Double Bottom on an Uptrend with Divergence

Lower Low on an Uptrend with Divergence

Fading Swing Highs & Lows
What happens when the market is not trending and moving sideways instead?
Since there’s no trend in place, then we don’t want to trade pullbacks or reversals because they will fail.
So we want to be careful when the market is moving in a sideways market.
How do you identify whether the market is moving sideways?
We look to the 2 EMAs to give us an indication if the market is moving sideways.
If the market is moving sideways, then the EMAs will cross each other often.
And if you look at the price action, you will notice that the market is forming irregular highs and lows.
That means it is forming higher highs but also lower lows at the same time, and also lower highs and higher lows.

When we see this, what we want to do is mark the previous swing highs and lows.
What we want to pay attention to is how the market reacts to these previous swing highs and lows.
Once the market reaches either of the swing lows or high, we want to wait for a bullish or bearish candlestick pattern to form respectively.
Let’s take a look at an example.

In the chart above, the market has formed the first swing high on the left-hand side of the chart.
Draw a horizontal line across the swing high then wait for the market to reach those highs.
As you can see, the market has gone up to the swing high on three separate times and each time forming a bearish candlestick pattern.
This would be the trigger to go Short once the market breaks below the low of the bearish candlestick patterns.
Don’t Rely on Indicators For Entries
There’s a reason why indicators are called “indicators”.
And it’s because they merely indicate what might be happening in the market.
The main indicator you should be looking out for is just price.
Price is the leading indicator and that should be what’s guiding you on whether to get into a trade or not.
Don’t go Long just because your RSI indicator is overbought.
Or don’t go Short just because the lower period moving average has just crossed below the higher period moving average.
Instead, let the indicators guide you on the market’s sentiment, then use price action to determine whether or not there’s an entry to be taken.
In this post, I’ve shared with you the 3 main indicators I used to trade trends and reversals.
However, I do not merely go Long or Short just because it tells me to.
Ultimately, I let price action decide my entries.
One more thing…
Did you like this post?
If you liked this post or felt it was helpful for you, would you please share it?
Remember, sharing is caring, and it won’t even take 5 seconds of your time.
So go ahead, click the share button below now to help more traders get an Edge trading the Forex market 
Leave a Reply