In trading, there are two popular trading strategies to trade the markets…
The first is to trade pullbacks.
The second is to trade reversals.
But how do you identify whether a pullback or a reversal trade will have a high probability of working out?
This is where many traders struggle.
Many times they enter into a pullback or reversal trade but the market never reverses back in the direction of their position.
So how then can you identify a reversal in the market with a high probability of it working out?
The answer is by identifying divergence.
If you want to go Long, then you want to be looking for bullish divergence.
And if you want to go Short, then you want to be looking for bearish divergence.
In this guide, I’m going to solely just cover everything you need to know about bullish divergence…
So that by the end of reading this guide, you will know exactly how to identify bullish divergence correctly and exactly how to trade it.
Let’s begin.
What is Bullish Divergence
So what exactly is divergence?
When it comes to trading, divergence is when the market is moving in a different direction than another correlated instrument or indicator.
For example, if you’re trading two highly correlated pairs like the EURUSD and EURCHF, a divergence occurs when EURUSD is going up but EURCHF is going down.
If you are using an indicator like the Stochastic Oscillator, then an example of divergence occurs when the market is forming lower lows but the Stochastic Oscillator is showing higher lows.
This is called a bullish divergence.
What does the bullish divergence signify?
It signifies that this might be a turning point where the market starts going up.
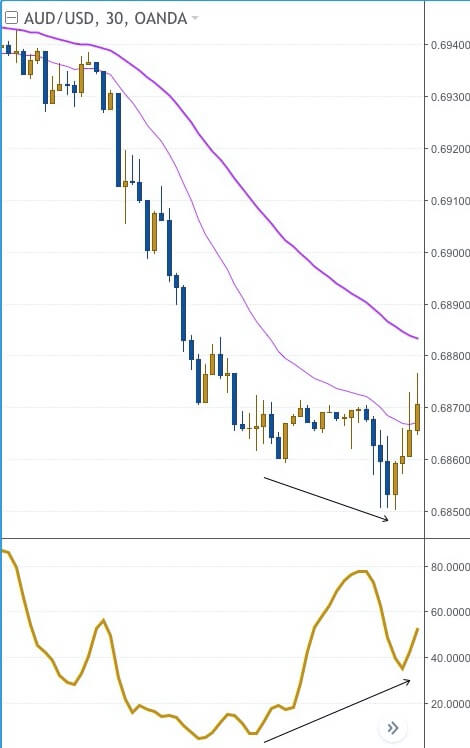
In the chart above, you can see that the market is in a strong downtrend moving below both Exponential Moving Averages (EMA).
But the indicator at the bottom of the chart is showing a higher low.
That means the indicator is indicating that this might be a bullish reversal point.
So which indicator should you use to identify a bullish divergence?
There are many indicators that can help you identify a divergence in the market, and here are four of the most common ones traders use:
- Relative Strength Index (RSI)
- Moving Average Convergence Divergence (MACD)
- On Balance Volume (OBV)
- Stochastic Oscillator
Most of the time, all of them will give the same divergence signals.
However, there are times where one indicator may give a divergence while the other won’t.
So how do you decide which indicator should you use?
It comes down to your own testing.
My preference is to use the Stochastic Oscillator as I’ve used it for years and it’s what works for me.
So for the rest of this guide, I’ll be using the Stochastic Oscillator to identifying bullish divergence.
Two Types of Bullish Divergence
When it comes to bullish divergence, there are two types:
- Regular Bullish Divergence
- Hidden Bullish Divergence
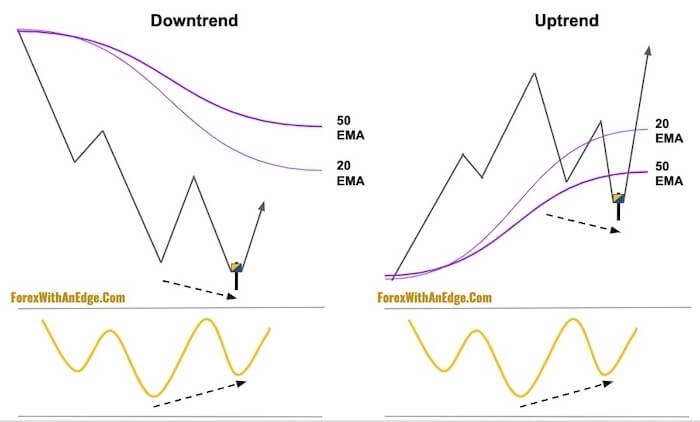
A Regular Bullish Divergence happens when the market is making a lower low but the indicator is making a higher low.
This is a how a Regular Bullish Divergence looks like:
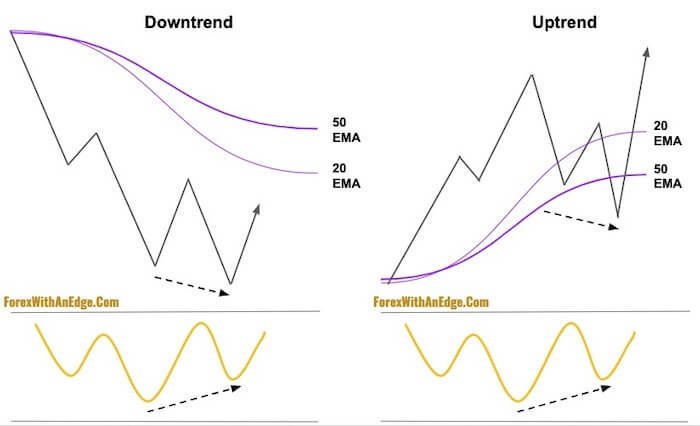
Most of the time, Regular Bullish Divergences appears in a downtrend.
However, there are times when it appears in an uptrend as well, as you can see in the diagram above.
In fact, some of my best trades come from trading the Regular Bullish Divergence in an uptrend because it is trading with the trend.
Whereas trading it in a downtrend is against the trend.
With the Regular Bullish Divergence, you can trade both a reversal in a downtrend and a pullback in an uptrend.
In the diagram above, I’ve added the 20 EMA and 50 EMA.
This is to easily help identify whether the market is in an uptrend or a downtrend.
If the 20 EMA is above the 50 EMA, we will consider the market to be in an uptrend.
If the 20 EMA is below the 50 EMA, we will consider the market to be in a downtrend.
When you know the market is in an uptrend or a downtrend, it will help you identify Regular Bullish Divergences much easily.
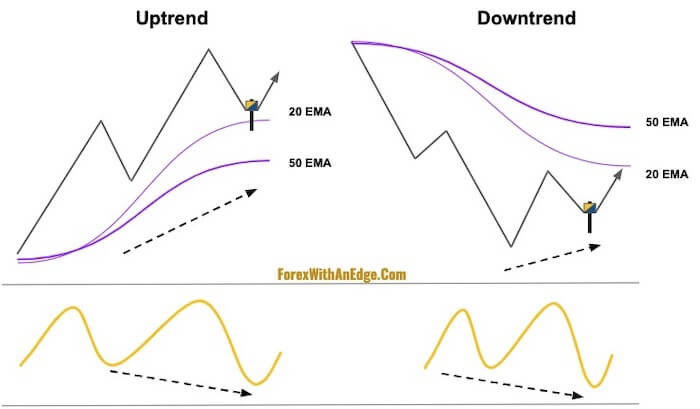
The next type of bullish divergence is called the Hidden Bullish Divergence.
A Hidden Bullish Divergence is when the market is making a higher low but the indicator is making a lower low.
This is how a Hidden Bullish Divergence looks like:
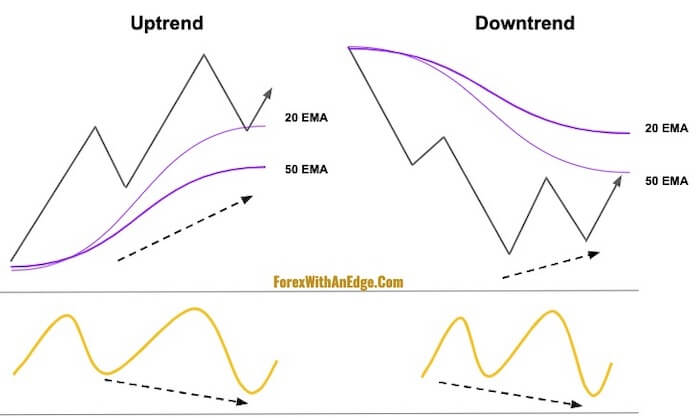
And similar to the Regular Bullish Divergence, it can happen both in an uptrend and a downtrend.
Most people only teach the standard Hidden Bullish Divergence in an uptrend.
However, it can also be used in a downtrend.
It doesn’t happen often…
But when it does, it can be a high probability signal of a reversal.
With the Hidden Bullish Divergence, you can trade a pullback in an uptrend and a reversal in a downtrend.
Why Trade Bullish Divergence
Now, you might be thinking:
“Is identifying divergence really necessary?”
The answer is…
Yes, if you want to have an idea of whether the market might be turning.
You see, when you identify a bullish divergence in the market, it can help you with 3 key trading decisions:
- Get you into a Long trade.
- Exit your Short trade.
- Stay out of trades altogether.
Let’s take a look at the chart below:
Now, if you aren’t in a trade yet, then by seeing this bullish divergence on the chart you might consider entering into a reversal trade.
But if you are already in a Short trade, then seeing this bullish divergence can be a signal for you to exit the trade.
And if you have another trade setup that says it’s time to Short the market but you see this bullish divergence…
Then you may consider to skip this trade and wait for another trade setup when there’s no divergence.
As you can see, with divergence, it can not only help you with your trade entries but also with your exits.
It is a useful tool to have in your trading arsenal.
Now, that you know exactly what bullish divergence is and why you should use it…
Let’s get into the specific trade setups for both the Regular Bullish Divergence and the Hidden Bullish Divergence.
Bullish Divergence Trade Setups
When trading bullish divergences, there are two entry triggers to enter into a trade:
- Using bullish candlestick patterns as your entry trigger.
- Using a close above the 20 EMA as your entry trigger.
Entry Trigger #1: Bullish Candlestick Patterns
While there are many bullish candlestick patterns, we only need to look for 3 of them as they will comprise most of the trades:
- Bullish Pin Bar
- Bullish Piercing Pattern
- Bullish Engulfing Pattern

So what we are looking for is for either of these 3 bullish candlestick patterns to form as our entry trigger.
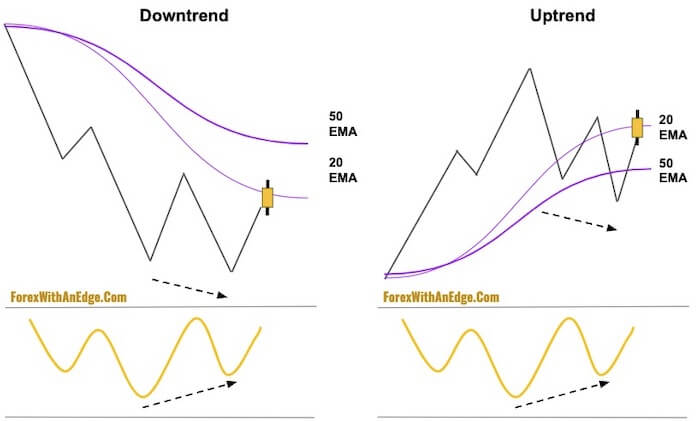
Here’s what you are looking out for on the chart for the Regular Bullish Divergence setup:
In the diagram, I’ve used the Bullish Pin Bar to represent the bullish candlestick patterns.
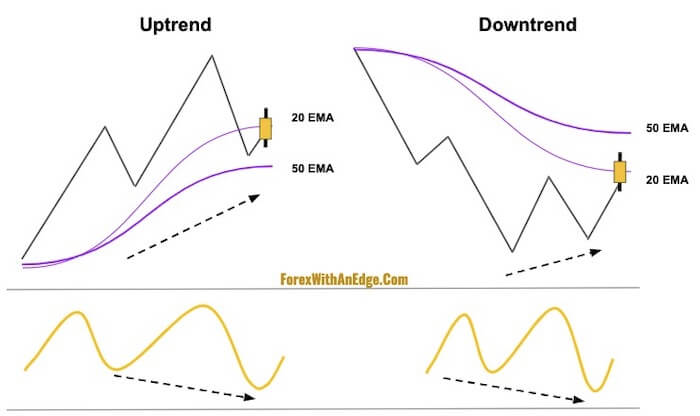
For Hidden Bullish Divergence, this is what you want to look for on the charts:
There are 3 entry methods to get into a trade after the bullish candlestick patterns are formed:
Method #1: At the Close
This is the most aggressive entry method of the three.
Basically, you enter into a trade once the candlestick bar closes using a Market Order.
A Market Order is to take the best available price at that point in time.
So once the candlestick closes, you will go Long by “lifting the Offer”, which means to buy at the best available Offer.

Method #2: Break of High
The second entry method is to enter into a trade at the break of the high of the candlestick.
To go Long with this entry method, once the candlestick closes, you place a Buy Stop Order above the high of the candlestick.

With this method, it’s more conservative than the first entry method and is the most common entry method traders use.
For this entry method, we use a Buy Stop Order.
What a Buy Stop Order does is that when the market hits that level, it will trigger a Market Order to buy at the best available price.
So depending on how quickly the market goes above this level, there can be negative slippage.
Negative slippage happens when you get filled at a worse price than your Buy Stop Order level.
So for example, if you place a Buy Stop Order at 1.0000, with negative slippage it might fill you at 1.0001.
This is the opposite of Limit Orders where you can get a positive slippage.
That means if you place a Buy Limit Order at 1.000, with positive slippage you might get filled at 0.9999.
So if you do not want negative slippage, an alternative way to enter into a trade with this method is when the market breaks the high of the bullish candlestick…
You place a Buy Limit Order at the high.
This way, you will not get negative slippage, and even possibly get positive slippage.
However, you run the risk of the market not coming down to your Limit Order as it can continue to go up once it breaks the bullish candlestick’s high.
So this is the trade-off you need to balance.
Method #3: Close Above the High
The last entry method is the most conservative of all three methods.
And that is to wait for the market to close above the high of the 3 bullish candlestick patterns before going Long.

Similarly, this method uses a Market Order to go Long.
But you can also place a Limit Order once the candlestick bar closes, just like in the second entry method.
Here’s an overview of the 3 entry methods using bullish candlestick patterns:

In the diagram above, I used a Bullish Pin Bar with a bearish body to illustrate the distinct difference between the risk-to-reward ratios for the 3 entry methods.
As for the Stop Loss, it’s placed below the low of the bullish candlestick bar.
And as you can see, the first entry method has the greatest biggest risk-to-reward ratio, followed by the second entry method, then the third entry method.
However, there is a trade-off for having a better risk-to-reward ratio…
And that is that there will be more frequent stop-outs.
For example, the first entry method may have gotten an early entry into the trade…
But if the market reverses immediately and hits the Stop Loss, then the second and third entry method wouldn’t even get an entry.
This is the trade-off for getting an earlier entry at a better price.
So how do you decide which method to use?
If you’re just starting out, I suggest either using the second or third entry method as they are less prone to false signals than the first entry method.
I use the third entry method but instead of entering right at the close of the bar, I place a Buy Limit Order below it.
So if the candlestick closes at 100.50, I might place a Buy Limit Order at 100.40 (depending on how far away the close is from the high of the bullish candlestick bar).
This way I can get a better risk-to-reward ratio and have a conservative entry.
The downside to this is that I may miss the trade if the market continues to go up with coming down to fill my Buy Limit Order.
Entry Trigger #2: A Close Above 20 EMA
The other way to get into a trade is by using the 20 EMA.
To get into a trade with the 20 EMA, wait for the market to move below the 20 EMA first…
Then once it comes back up to close above it, that will be our signal to go Long.
For this entry trigger, we do not need to look at candlestick patterns.
As long as the market closes above the 20 EMA, we go Long.
Then place Stop Loss below the swing low.
This method is generally a more conservative entry than the bullish candlestick pattern entry because you will tend to get in the market later.
And it also leaves less room for discrepancy.
For example, some traders might debate whether a candlestick pattern is considered either of the three bullish candlestick pattern.
But there is no discrepancy for a close above the 20 EMA.
As long as it closes above the 20 EMA, that is our trigger to go Long.
So here’s what you looking for on the chart with a Regular Bullish Divergence:
And here’s what you looking for on the chart with a Hidden Bullish Divergence:
Now that you know the two entry methods, let’s get into the actual trade setups.
Regular Bullish Divergence Trade Examples
Here are the entry rules to get into a Regular Bullish Divergence trade:
Step 1: Look for the market to form either a Double Bottom or a lower low. This can either be formed in an uptrend or a downtrend.
Step 2: Once the Double Bottom or lower low is formed, look at the Stochastic Oscillator to see if it formed a higher low indicating a bullish divergence.
Step 3: If there’s a bullish divergence, see if one of the three bullish candlestick patterns is formed. If there is, use either of the candlestick entry methods to go Long.
Step 4: If there’s no bullish candlestick pattern formed, wait for the market to go above the 20 EMA. Once it closes above the 20 EMA, either go Long using a Market Order or place a Buy Limit Order below the close.
Step 5: Place Stop Loss below the low of either the bullish candlestick pattern or the current swing low.

The chart above is on the USDJPY 4-hour timeframe.
As you can see on the left-hand side of the chart, the market has been trending downwards making lower lows.
At the second bottom (which is the lower low), there wasn’t a bullish candlestick pattern formed.
Now, some may say that’s a Bullish Piercing Pattern, but it didn’t close above the halfway mark of the previous candlestick bar.
So instead, we will wait for the market to close above the 20 EMA to go Long.
When the market finally closes above the 20 EMA at around 111.50, that is our trigger to go Long.
Alternatively, you might want to place a Buy Limit Order below it at 111.40 or 111.30.
If you placed at 111.30, you would have missed the trade (which I did because I placed at 111.30 looking for a better entry).
Once you are Long, place a Stop Loss below the low of the current swing low.
Since the current swing low is around 110.85, you’d want to place your Stop Loss around 110.70.
Be careful not to place your Stop Loss too close to 110.85 as that’s the obvious place where the institutions will stop-hunt.
Here’s another Regular Bullish Divergence trade example in an uptrend:
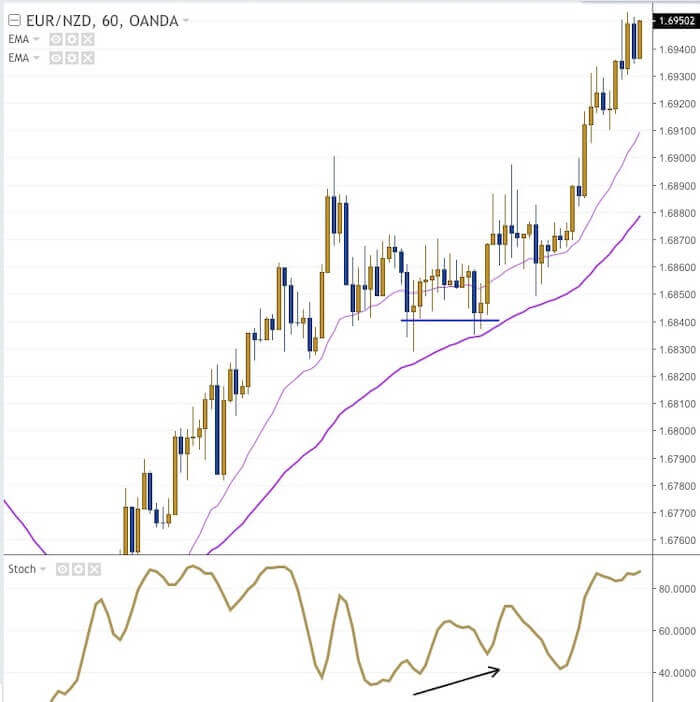
This trade is on the EURNZD 60-mins chart.
As you can see, the market has been in a strong uptrend and trading above the 20 EMA.
Then the market did a pullback to in-between the 20 EMA and 50 EMA.
At that point, it formed a small Double Bottom.
Technical analysts might say it’s a cup and handle pattern.
Regardless, it’s a good trade setup because the Stochastic Oscillator is showing a higher low.
And in this trade as well, there’s no bullish candlestick pattern.
So we wait for a close above the 20 EMA to go Long.
The market eventually went up above the 20 EMA and closed at 1.6868.
To go Long, you can either buy at the market or place a Buy Limit Order below at 1.6860.
Stop Loss is placed at some distance below the swing low at 1.6820.
This gives a Stop Loss distance of 40 pips.
Then place a Take Profit level of either 1.5R or 2R.
Both of which did get hit.
Here’s one more example but with a bullish candlestick pattern entry.

On the left-hand side of the chart above, you can see that the market had been in a strong uptrend trading above the 20 EMA.
Then the market started to drop below the 50 EMA and the 20 EMA eventually crossed below the 50 EMA.
At this point, the market formed a lower low.
But the Stochastic Oscillator is showing a higher low for a divergence.
At the lower low, the market formed a Bullish Piercing Pattern.
If you used the first entry method, you would have gone Long at around 1.3115.
If you used the second entry method, you would have gone Long at around 1.3127.
And if you used the third entry method, then you would have gone Long at around 1.3133.
So if you noticed, with a bullish candlestick pattern entry, you usually can get an earlier entry compared to the entry using the 20 EMA.
Hidden Bullish Divergence Trade Examples
Here are the entry rules to get into a Hidden Bullish Divergence:
Step 1: Look for the market to form a higher high. This can be formed either in an uptrend or a downtrend. The difference is that with an uptrend if there is a bullish candlestick pattern formed, we want it to be formed on either the 20 EMA or the 50 EMA. This is because the EMAs can serve as dynamic support levels and if a bullish candlestick pattern is formed there, it gives us a stronger indication that the market is likelier to go up.
Step 2: Once the higher low is formed, look at the Stochastic Oscillator to see if it formed a lower low indicating a bullish divergence.
Step 3: If there’s a bullish divergence, see if one of the three bullish candlestick patterns is formed. If there is, use either of the candlestick entry methods to go Long.
Step 4: If there’s no bullish candlestick pattern formed, wait for the market to close above the 20 EMA. If it closes above the 20 EMA, either go Long using a Market Order or place a Buy Limit Order below the close.
Step 5: Place Stop Loss below the low of either the bullish candlestick pattern or the current swing low.
Let’s take a look at an example.
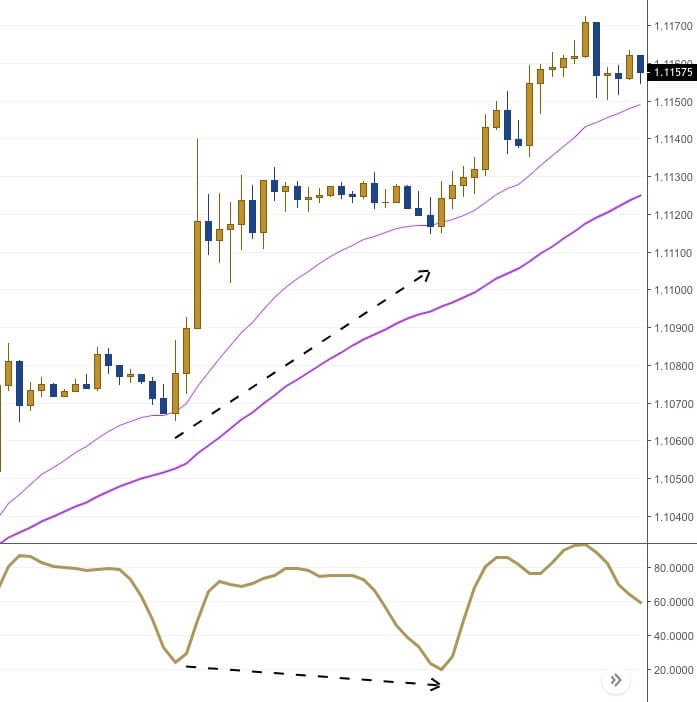
The chart above shows a bullish candlestick pattern entry.
As you can see on the left-hand side of the chart, the market had been in a strong uptrend trading above the 20 EMA.
The market then did a pullback to the 20 EMA and formed a Bullish Engulfing candlestick.
However, there was no divergence there so we do not enter into a trade.
The market then did another pullback to the 20 EMA again and formed another Bullish Engulfing candlestick.
At this point, there is a divergence as the Stochastic Indicator is showing a lower low while the market is making a higher low.
So this is a valid trade setup.
Using either of the entry methods would have given you a good entry as the following candles did not close too far off from the Bullish Engulfing candlestick.
Place Stop Loss below the low of the Bullish Engulfing candlestick at 1.1110.
Here’s another trade example:
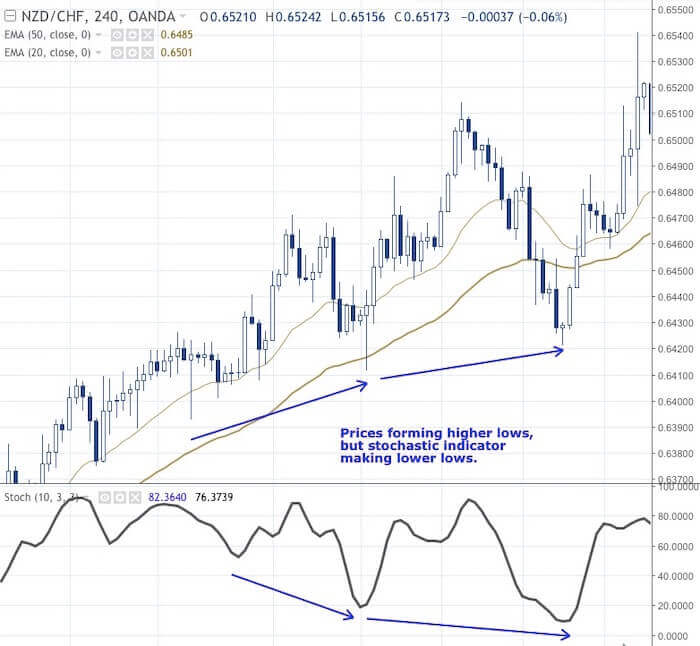
In the chart above, you can see that there are two consecutive Hidden Bullish Divergence trades.
The first trade is where the Bullish Pin Bar was formed after touching the 50 EMA.
In this case, using either the candlestick entry or 20 EMA entry would have roughly the same Long entry price.
In the second trade, you can see that a Bullish Pin Bar was also formed.
Since the Bullish Pin Bar would give us a better entry than a close above the 20 EMA, we enter into a trade using the bullish candlestick pattern entry trigger.
Alternatively, if you are more conservative, you can wait for the market to close above the 20 EMA before going Long.
If you did that, you would have gone Long only around 0.6475 where the candlestick closed above the 20 EMA.
However, since the Stop Loss is placed below the current swing low at around 0.6415, that would give a wide Stop Loss distance of 60 pips.
So in such a situation, I will choose to place a Buy Limit Order below at around where the EMAs are, which is around 0.6450 to 0.6460.
This way I can get a tighter Stop Loss which can allow me to hit my 1.5R or 2R Take Profit level more easily.
Here’s one more example of a Hidden Bullish Divergence but in a downtrend:

In the chart above, you can see on the left-hand side that the market has been trading below the 20 EMA.
Then the market started to go sideways and formed somewhat like an inverse head and shoulders pattern.
What we are looking at is the last two bottoms that formed a higher low.
At the same time, the Stochastic Oscillator is indicating a hidden divergence as it formed a lower low.
And at the last bottom, the market formed a Bullish Engulfing candlestick.
So for this trade, you can get an early entry using the first or second entry method.
If you used the third entry method, it would be the same entry price as the EMA entry method.
Then place Stop Loss below the low of the Bullish Engulfing candlestick.
And similarly, place your Take Profit level at either 1.5R or 2R.
Conclusion
The bullish divergence strategies that you have learned in this guide are my bread and butter setups.
And the reason is that they give me high probability trades.
All I do each day is scan the market to see if there are any divergence setups.
If there isn’t, I simply sit on my hands and wait until there is a divergence.
And if you want to have high probability trades, then you want to consider using divergence in your trading as well.
Now it’s your turn.
Do you trade bullish divergence?
Let me know in the comments below.
One more thing…
Did you like this post?
If so, would you please share it?
Remember, sharing is caring, and it won’t even take 5 seconds of your time.
So go ahead, click the share button below now 
Leave a Reply