
Looking for the best indicators or indicator combinations that can help you trade better?
I’m going to let you in on a secret…
Ready?
The secret is…
There are no “best” indicators or “best” indicator combinations…
And the reason is that it all comes down to how you the indicators for your trading style.
One trader might have great success with an indicator, but another trader might find it totally useless.
So, listen up because this is very important…
I don’t want you to be stuck with the mentality of having to search for the “best” indicators or the “best” combination of indicators.
Instead, find the indicators that best suits the needs of your trading style…
But only use it as a way to help you read the market better.
What you want to rely on instead is price action to determine your trade entries.
Now, with that said, there’s definitely a place for indicators.
And that is that indicators can help you identify trends better…
It can help you identify when there might be a reversal…
And it can also help you identify when it might not be ideal to get into a trade.
That’s what I use indicators for.
And that’s what you want to use indicators for as well.
So in this post, I’m going to share with you 7 indicators that can help you read the market better…
And I’m also going to share with you how professional traders combine some of these indicators to trade the markets.
Ready?
Let’s go.
1) Exponential Moving Average
The Exponential Moving Average (EMA) is by far one of the most common indicators that traders used.
It’s also one I rely on to identify what trades I should be looking for.
And it’s also very useful for identifying trends.
The most common way traders use the EMA is by having two or more EMA with different periods.
For example, many traders like using the 10 EMA & 20 EMA for momentum trades.
I personally use the settings of 20 EMA & 50 EMA.
And trend-following traders tend to use long periods like 100 EMA & 200 EMA.
There is no right, wrong or “best” setting for using the EMA.
It ultimately comes down to whether you can get it to work for you.
But there is a wrong way to use it and that is to trade based on its crossover.
For example, there are traders that would enter a trade when the shorter period EMA crosses over the longer period EMA.
So assuming we are using the 10 EMA & 20 EMA, the trader would get into a Long trade when the 10 EMA crosses above the 20 EMA.
And the trader will get into a Short trade when the 10 EMA crosses below the 20 EMA.

If you traded that way in the chart above, you would have been stopped out continuously.
While this way effective decades ago when there was no computer to chart prices, this method of getting into trades will only get you into many whipsaws.
So while there are no “wrong” settings to use, there is a “wrong” way to trade it.
2) Stochastic Oscillator
The Stochastic Oscillator is a momentum indicator that is most commonly used by traders to identify if the market is “overbought” or “oversold”.
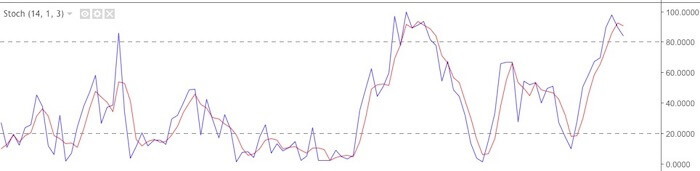
You can see in the image above that there are two dotted horizontal lines.
One at the “80” level and the other at the “20” level.
The general consensus is that when the stochastic indicator has a value above 80, the market is considered overbought and that the market should come down.
And when the stochastic indicator has a value below 20, then the market is considered oversold and should come back up.
The way many traders get into a trade is when the stochastic lines go either above 80 or below 20, and then go Short or Long when the lines cross each other.
So for example, if the two lines go above 80 and then the blue line crosses below the red line, it’s a sell signal.
And if the two lines go below 20 and then the blue line crosses above the red line, it’s a buy signal.

However, be very careful when using the stochastic indicator to trade this way because if the market is in an uptrend, an overbought “sell” signal can continue to go up and be more overbought.
Similarly, if the market is in a downtrend, an oversold “buy” signal” can continue to go down and be more oversold.
This way of trading is only effective when the market is moving sideways.
But in a trending market, you certainly do not want to trade it this way.
Another way that traders use the Stochastic Oscillator is by using it to identify divergence in the market.
That’s my preferred way of using the Stochastic Oscillator.
When used properly, it can be very effective in identifying possible reversals in the market.
3) Bollinger Band
The Bollinger Band is another popular indicator that many traders use.
The way many traders use the Bollinger Band is to identify when there might be an increase in volatility in the market with the bands.
When the bands contract, it’s a sign of decreased volatility in the market.
And when the bands expand, it’s a sign of increased volatility in the market.
One of the ways that traders use the Bollinger Band is to trade Mean Reversion Strategies.
For example, when the market moves above the upper band, they go Short.
And when the market moves below the lower band, they go Long.

Another way is to use it to trade breakouts when the market’s volatility increases.
When the market is quiet, the bands will contract and be very narrow.
But when there is a sudden movement in the market, the bands will expand and traders will see that as a possible breakout trade.
4) Keltner Channel
The Keltner Channel is also another indicator that gives us an indication of the market’s volatility.
Similar to the Bollinger Band, it has an upper and lower channel.
This channel adapts to changes in the volatility of the market and is used to indicate possible breakouts.
For example, if the channel is narrow, then a move above or below the channels can indicate a breakout.
5) Momentum Oscillator
The Momentum Oscillator is an indicator where traders use as a way to determine where the general direction of the market is headed.
This indicator was created using a formula that calculates the difference between the total recent gains and the total recent losses and the result is then divided by the total of all price movement over a defined period.
That sounds complicated, I know.
But the interpretation is simple…
If the reading is above zero, then it’s indicating that the momentum is headed upwards.
And if the reading is below zero, then it’s indicating the momentum is headed downwards.
With that said, just like the Stochastic Oscillator, it can be used in different ways depending on the trader’s trading strategy.
6) Donchian Channel
Similar to the Bollinger Band and Keltner Channel, the Donchian Channel is another indicator that has an upper and lower band.
However, the difference is the Donchian Channel tracks the highs and lows of the market over a defined period set by the trade.
For example, if you set the Donchian Channel to a period of 20, then it will draw a channel to show where the high and low is for the past 20 candlesticks:

The way traders use the Donchian Channel is by trading in the direction of where the market breaks out of the channel.
So if the market moves above the upper band, that is a signal to go Long.
And if the market moves below the lower band, that is a signal to go Short.
This is one of the most popular indicators used by trend followers.
7) Average True Range
The Average True Range (ATR) is a volatility indicator that’s used to identify the market’s range over a defined period of time.
By default, the ATR setting is 14.
That means it tracks the average range of the last 14 bars.
So if the ATR (14) gives a reading of 50 on the 1-hour chart, then it means that over the past 14 hours, the average movement of the currency pair is 50 pips.
Unlike the other indicators above where traders often use it as a way to get into a trade, the ATR is most commonly used to place Stop Losses.
So for example, if the ATR reading is 50, traders might choose a multiple of the ATR to place their Stop Loss away from their entry.
If the trader decides to place his Stop Loss at 2 ATR away, that means his Stop Loss will be 100 pips away from the entry.
And if the trader decides to place a Trailing Stop Loss of 1.5 ATR, it means that the Stop Loss will be always at most 75 pips away from where the market is traded.
How to Combine Indicators To Fit Your Trading Style
Now that you know what these indicators are and how to use them, let’s get into the different ways that traders combine these indicators.
One thing to understand is that there is no ONE right way to use the indicators.
Different traders have different trading styles.
And with the different trading styles, they adapt the indicators for their own use.
So what I’m about to share with you are just a few ways professional traders use these indicators.
However, it’s by no means the only way to use these indicators.
Understand the idea behind the indicator combinations, and then adapt them to your own trading style.
Indicator Combination #1: Bollinger Band + Keltner Channel + Momentum Oscillator
This indicator combination is used by John F. Carter in his book Mastering The Trade.
He calls this system the Bollinger Squeeze.
It’s designed to catch a big movement in the market after volatility picks up from a quiet market.
And in general, it is meant to trade with the trend.
For this strategy, he uses 3 indicators with the following settings:
- Bollinger Bands (20, 2.0)
- Keltner Channel (20, 1.5)
- Momentum Oscillator (12, close)
Entry Criteria:
Step 1: Wait for the Bollinger Band to go within the upper and lower bands of the Keltner Channel.
Step 2: Once the Bollinger Band is inside the Keltner Channel, look for the Bollinger Band to move out of the Keltner Channel.
Step 3: If the Momentum Oscillator is above zero, go Long at the close of the candle. If it is below zero, go Short at the close of the candle.
Step 4: Close the trade when the Momentum Oscillator shows a weakening in momentum.
So if you’re in a Long trade, close the trade when the Momentum Oscillator goes below zero.
And if you’re in a Short trade, close the trade when the Momentum Oscillator goes above zero.
Here’s an example of a swing trade in EURUSD using the 4-hour chart:

On the left-hand side of the chart, you can see that the Bollinger Band went inside the Keltner Channel.
Moments later, the market started to move out of both the Keltner Channel and the Bollinger Band and formed a long bar up that closed above both of the indicators.
At the same time, the Momentum Oscillator was showing a reading above zero so this is considered a Long entry.
A few bars later, the Momentum Oscillator went below zero, and that was the signal to exit the trade.
If you had used an ATR Stop Loss, then you would have still been in the trade and would catch the whole move up.
So as you can see, this indicator combination has the potential to help you catch big moves in the market when volatility increases.
Indicator Combination #2: Donchian Channels + ATR
This indicator combination is most commonly used by trend following systems.
And this really became famous because of the turtle traders.
The turtle traders’ core rules for getting into a trade is when the market breaks a certain day high or low.
And this Donchian Channel can help to visually represent when it’s time for traders to get into a trade.
As for the ATR, many trend traders use this to determine their Stop Loss.
For example, they might set their Stop Loss to 2 ATR.
So what that means is that if the ATR shows 20 pips, then their Stop Loss will be at 2 x 20 = 40 pips away from their entry.
Here’s a simple trend-following system that can be used with these two indicators.
Indicator Settings:
- Donchian Channel (20)
- ATR (14)
Entry Criteria:
Step 1: If the market breaks above the upper channel, go Long. If the market breaks below the lower channel, go Short.
Step 2: Place a Trailing Stop Loss of 3 ATR from the close of each candle. There will be no Take Profit level. The Trailing Stop Loss will either take you out of the market for a profit or a loss when it gets hit.
(Note: some people use a custom indicator on MT4 to visually show the Trailing ATR Stop Loss. But for my example, the Trailing Stop Loss has to be placed manually from the close of each candle.)
That’s it.
This is a very simple system, and let’s see an example of how it works.

On the left-hand side of the chart, we have our first entry as the market broke below the channel.
At this point, we place our Stop Loss at 3 ATR away from our entry.
As the market goes down, our Trailing Stop Loss moves down as well.
On the right-hand side of the chart, our 3 ATR Stop Loss finally gets hit and we’re out of the market.
Now, this trading strategy can cause a lot of whipsaws when the market goes sideways.
So you might want to consider adding one other indicator to filter the trades.
Some trend following traders will implement the “stop and reverse” method in their rules.
That means if the market hits the other side of the channel, they not only get out of their trade but also enter a new trade in the opposite direction.
This can be very hard to trade manually because you would have to stomach lots of stop-outs.
But if you program this as an Expert Advisor, you can let it trade automatically.
Indicator Combination #3: EMA + Stochastic Oscillator
This is my personal setup for swing trading and this is a very versatile setup because unlike the first two indicator combinations, I can trade with the trend and against the trend.
And the way I use it is to trade pullbacks and reversals with regular divergence and hidden divergence.
For this indicator combination, I use the following settings:
- 20 EMA
- 50 EMA
- Stochastic (10,3,3)
Pullback Trade Setup
Long Entry Criteria (Shorts are reversed):
Step 1: If the 20 EMA is above 50 EMA, we only look for a Long entry. Look for the market to form higher highs and higher lows.
Step 2: Wait for the market to make a pullback and close below the 20 EMA.
Step 3: If there is hidden divergence, wait for the market to close back above the 20 EMA.
Step 4: Go Long at the close of the bar above the 20 EMA.
Step 5: Place Stop Loss below the swing low, and place Take Profit at 1.5R or 2R.

In the chart above, the market is making higher highs and higher lows, and the 20 EMA is above the 50 EMA.
At this point, we are only looking for a Long trade.
The market did a pullback to the EMA and it closed below both the 20 EMA and the 50 EMA.
At this point, the Stochastic Oscillator is showing a hidden divergence where the market is forming higher lows, but the stochastic indicator is making lower lows.
The market then went above the 20 EMA and close above it.
This is our signal to go Long.
Reversal Trade Setup
Long Entry Criteria (Shorts are reversed):
Step 1: Look for the market to be trading below both EMAs with the 20 EMA below the 50 EMA.
Step 2: Look for a double bottom or a lower low.
Step 3: See if the Stochastic Oscillator is showing a divergence.
Step 4: If there is divergence, go Long when the market closes above the 20 EMA.
Step 5: Place Stop Loss below swing low and Take Profit at 1.5R or 2R.

On the left-hand side of the chart above, you can see that the market is in a downtrend and the 20 EMA is below the 50 EMA.
The market then formed a lower low, but the Stochastic Oscillator is showing a higher low.
There is a divergence.
Once the market closes above the 20 EMA, we go Long.
Conclusion
What I’ve shared with you in this post are some of the ways traders combine indicators to create a trading strategy.
But you do not have to use it the same way.
Instead, use it as a guide to developing your own trading strategy.
And remember, there isn’t a “best” indicator or “best” indicator combination.
One indicator combination setup might be perfect for one trader, but of no use to another.
So it comes down to finding one that suits your trading style.
Now it’s your turn…
What indicator combinations have you tried so far?
Let me know in the comments below!
One more thing…
Did you like this post?
If you liked this post or felt it was helpful for you, would you please share it?
Remember, sharing is caring, and it won’t even take 5 seconds of your time.
So go ahead, click the share button below now to help more traders get an Edge trading the Forex market 
Leave a Reply