
Looking to go Short with Hidden Divergence?
In my previous post, I went into detail on how to identify the Hidden Bullish Divergence…
How to trade it…
And also gave a few Forex trading examples to show you how I entered and exited Hidden Bullish Divergence trades.
In this post, I’m going to get into its counterparty – the Hidden Bearish Divergence.
Similarly, I’ll be going into details on how to spot the Hidden Bearish Divergence…
Exactly how to trade it with detailed entry and exit rules…
And I’m going to share with you a few trading examples as well for the Forex market.
What is Hidden Bearish Divergence
When it comes to trading divergence, there are generally two types of divergence:
- Regular Divergence
- Hidden Divergence
Regular Divergence is typically used to trade reversal patterns like Double Tops & Double Bottoms, and Higher Highs & Lower Lows.
Whereas Hidden Divergence is typically used to trade pullbacks in a trend.
When the market is in a downtrend, the market will form Lower Lows and Lower Highs.
These Lower Highs are the pullbacks in a downtrend.
And when the market is in an uptrend, the market will form Higher Highs and Higher Lows.
These Higher Lows are the pullbacks in an uptrend.
What Hidden Divergence does is to identify the pullbacks that are most likely to work out.
That means to identify high probability pullback trades.
And what we will be focusing on in this post is to identify the high probability pullback trades in a downtrend using Hidden Bearish Divergence.
So a Hidden Bearish Divergence occurs when the market is in a downtrend forming Lower Highs…
But the indicator is showing a Higher High.
Which Indicator Should You Use to Trade Divergence?
There are a few indicators that can identify divergence.
Some of the more commonly used ones are:
- Relative Strength Index Indicator (RSI)
- Stochastic Oscillator
- Moving Average Convergence Divergence (MACD)
- On-Balance Volume (OBV)
While they all can produce similar signals, the indicator that I like to use to trade divergence is the Stochastic Oscillator.
That’s because the Stochastic Oscillator has a smoother signal line and thus create clearer divergence signals.
For example, this is how divergence on the RSI Indicator looks like:

The red arrows in the chart above show where the divergence has occurred.
As you can see, the RSI Indicator produces rather jagged lines.
Here is how divergence on the Stochastic Oscillator looks like:

As you can see in the chart above, the Stochastic Oscillator produces a much smoother line than the RSI Indicator.
While many traders have no problems using the RSI Indicator, my preference is to use the Stochastic Oscillator.
With that said, there is no “better” indicator to identify divergence.
They all produce similar signals.
So it comes down to which indicator you feel most comfortable with.
For our purpose, we will be using the Stochastic Oscillator for the rest of this post.
How to Identify Hidden Bearish Divergence
When there is no Hidden Bearish Divergence in the market, the Stochastic Oscillator will mimic the wave pattern of the market.
That means when the market is forming Lower Highs, the Stochastic Oscillator will also form Lower Highs.
But when a Hidden Bearish Divergence occurs, the Stochastic Oscillator will deviate from the wave pattern of the market.
That means when the market is forming a Lower High, the Stochastic Oscillator will instead form a Higher High.
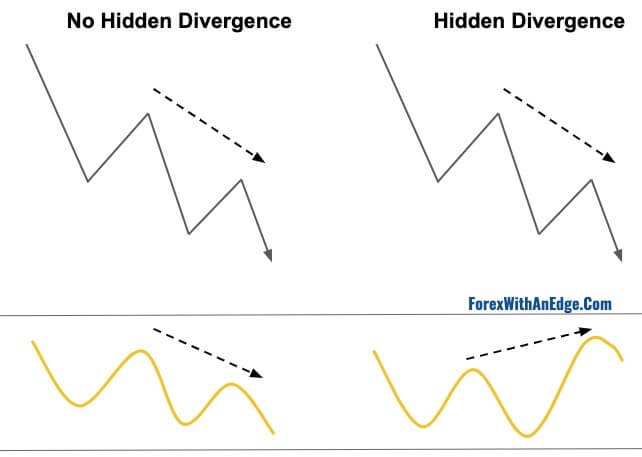
The diagram above shows the difference when there is no divergence and when there is a divergence.
You want to really take note of the difference so that you can identify it on your charts when you trade.
Now, the diagram above is when the market is in a downtrend.
That means it’s forming Lower Highs and Lower Lows.
However, a Hidden Bearish Divergence can also occur when the market is in an uptrend.
And it occurs when the market forms a Lower Low in a downtrend, but the Stochastic Oscillator is showing a Higher High.

In the diagram above, you can see that the market is in an uptrend forming a High High and Higher Low.
Then the market started to form a Lower High, but the Stochastic Oscillator is showing a Higher High.
This is also a Hidden Bearish Divergence.
Though this occurrence is rare, when it occurs it can be a high probability trade.
Now that you know how to spot a Hidden Bearish Divergence, let’s get into the specific trading setup to trade it.
Entry & Exit Rules For Trading Hidden Bearish Divergence
There are two trading setups for Hidden Bullish Divergence.
One in a downtrend, and the other in an uptrend.
For both setups, I’ve added two Exponential Moving Averages – the 20 EMA and 50 EMA.
The two EMAs will help set the trading criteria.
Here’s what we are looking for in a downtrend:
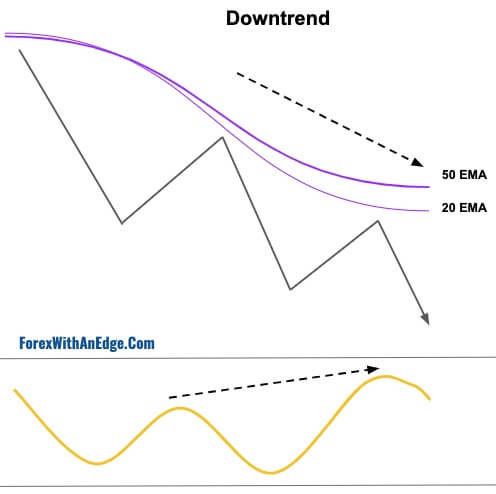
Here are the entry rules to trade a Hidden Bullish Divergence in a downtrend:
- For a downtrend, we want the 20 EMA to be below the 50 EMA and for the market to trade below the 20 EMA.
- Once the market has started trading below the 20 EMA, we are looking for the market to make a pullback to the EMAs to form a Lower High. In the pullback, I’m looking for the market to close above the 20 EMA.
- Then we want the market to close back below the 20 EMA. Once the market closes below the 20 EMA forming the Lower High, we want to see if there is a Hidden Bearish Divergence on the Stochastic Oscillator. If the Stochastic Oscillator is showing a Higher High, there is a Hidden Bearish Divergence and that is our signal to go Short.
- To go Short, either enter at the close of the candlestick bar below the 20 EMA, or place a Sell Limit Order above the close for a better entry.
- Place Stop Loss above the Lower High and place the Take Profit level at 2R. Once the market reaches close to our Take Profit level, move the Stop Loss to breakeven.
Here’s what we are looking for in an uptrend:
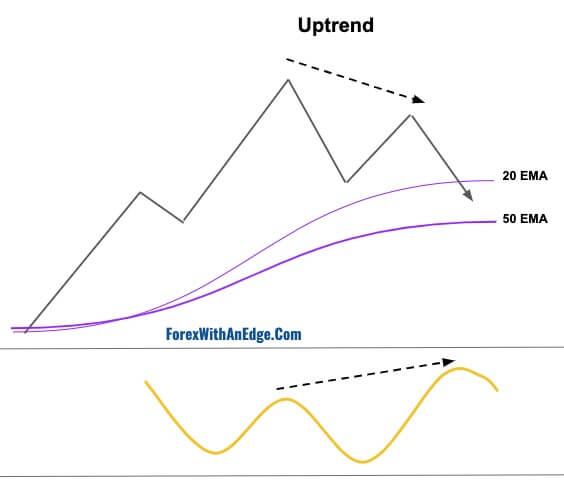
Here are the entry rules to trade a Hidden Bearish Divergence in an uptrend:
- For an uptrend, we want to see that the 20 EMA is above the 50 EMA, and the market is trading above the 20 EMA.
- Then we want to wait for the market to form a Lower High.
- When the Lower High is formed, take a look at the Stochastic Oscillator to see if there’s Hidden Bearish Divergence. If the Stochastic Oscillator is showing a Higher High, there is Hidden Bearish Divergence.
- Then wait for the market to close below the 20 EMA. Once it closes above the 20 EMA, that is our signal to go Short.
- To go Short, either enter at the close of the candlestick bar below the 20 EMA, or place a Sell Limit Order above the close for a better entry.
- Place Stop Loss above the Lower High and place the Take Profit level at 2R. Once the market reaches close to our Take Profit level, move the Stop Loss to breakeven.
Now that you know the entry rules, let’s get into a few trading examples.
For each of the trade, I will walk you through what I see on the charts…
My thought process on entering into the trade…
And how the trades eventually turned out.
Trading Example #1: EURUSD
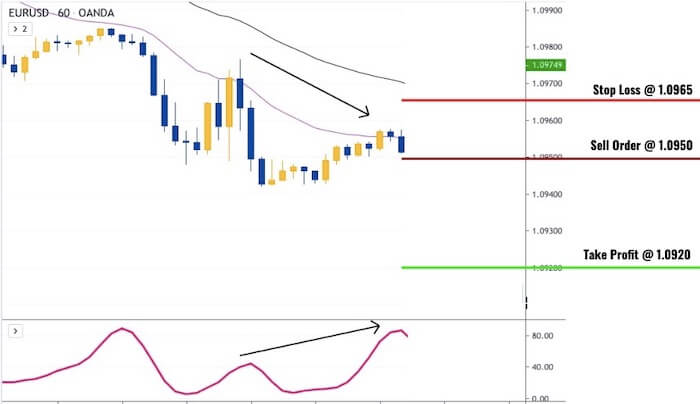
This trading example is on the EURUSD 1-hour chart:
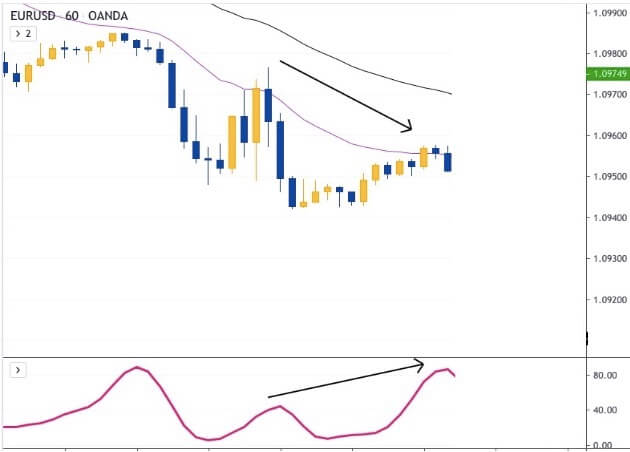
This chart above is a trading example of a Hidden Bearish Divergence in a downtrend.
- The market is in a clear downtrend from the left-hand side. The 20 EMA is below the 50 EMA and the market is trading below the 20 EMA.
- The market then did its first pullback to the 20 EMA, touched it, then went back down again. At that point, there was no Hidden Bearish Divergence as the market was showing a Lower High and the Stochastic Oscillator is also showing a Lower High. It then did a second pullback to the 20 EMA and this time closed above it. The market then came back down in two bars to close below the 20 EMA forming another Lower High.
- At this point, the Stochastic Oscillator is showing a Higher High indicating a Hidden Bearish Divergence. This was my signal to go Short.
- Since the close was very near to the 1.0950 level, I decided to either go Short at 1.0955 or 1.0950 depending on where the market went to first. However, the market didn’t go up to 1.0955 but went down to 1.0950 and I went Short at that level.
- I then placed my Stop Loss at 1.0965 for a 15-pip Stop Loss distance and placed my Take Profit level 30 pips away from where I went Short at 1.0920 for a 2R profit.
This is how it looked like on the chart:
This was the outcome of the trade:
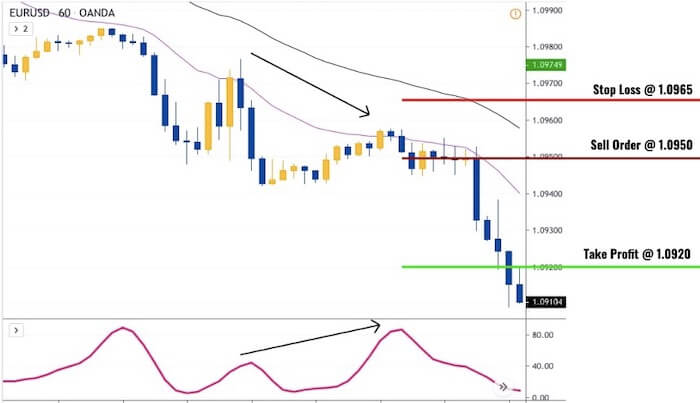
Right after I got Short, the market started to consolidate and go sideways for a while.
It kept touching the 20 EMA but it couldn’t close above it.
This was a positive sign to me because it shows the 20 EMA has held up as a dynamic resistance level.
Shortly after, the market tanked and hit my Take Profit level at 1.0920 for a 2R profit.
Trading Example #2: USDJPY
This is a trading example on the USDJPY 1-hour chart:
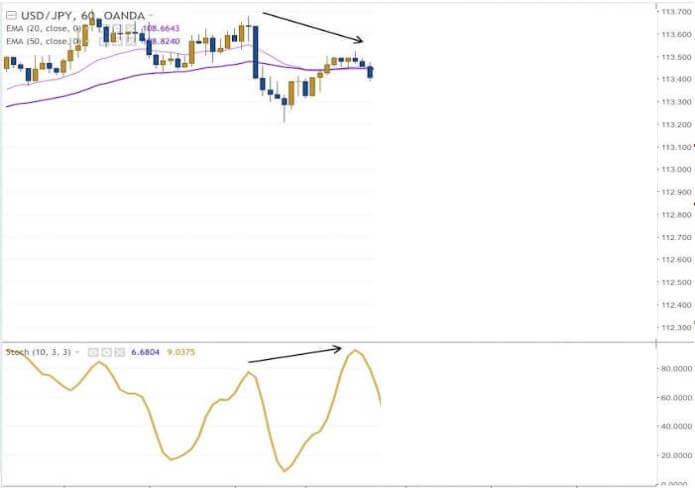
The chart above is a Hidden Bearish Divergence trade in an uptrend.
- From the left-hand side of the chart, you can see that the market has been in an uptrend.
- The market then dipped below both the EMAs and then came back up above them again. At this point, the 20 EMA was just above to cross over the 50 EMA indicating a change in trend. This is also a good indication for me as I was planning to go Short.
- The market then came back down below both the EMAs and closed below it. This formed the Lower High.
- At the point where the Lower High was formed, the Stochastic Oscillator formed a Higher High indicating a Hidden Bearish Divergence. This was my signal to go Short.
- The market closed slightly below 113.40 so I place a Sell Limit Order at 113.40.
- Then I placed my Stop Loss above the Lower High at 113.60 giving me a Stop Loss distance of 20 pips. Then I placed my Take Profit level at 2R which is 60 pips away from my entry level at 112.80.
This was how it looked like on the charts:

This is how the trade turned out:

As you can see, after I got filled, the market started to tank immediately.
It even went past my Take Profit level by quite a bit.
However, I’m satisfied with where I took profit because according to my testing, 2R profit is optimal for this strategy.
So as a trader, you want to be disciplined.
You can’t always get out at the high or low.
You only take what you have planned to take, and rinse and repeat your trading setup.
As long as your trading system is profitable and has a positive expectancy, then that’s all that matters.
Trading Example #3: GBPUSD
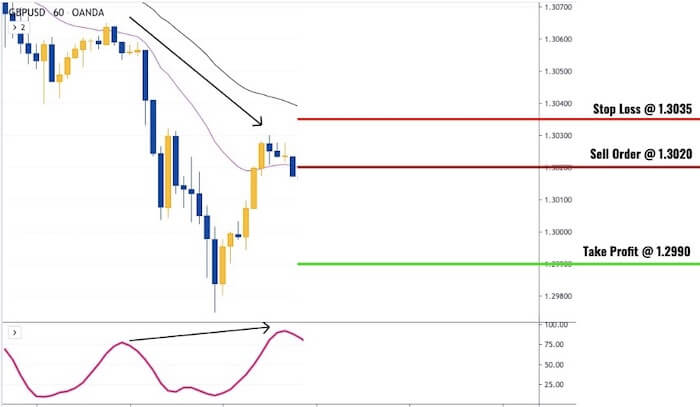
This is a trading example on the GBPUSD 1-hour chart:
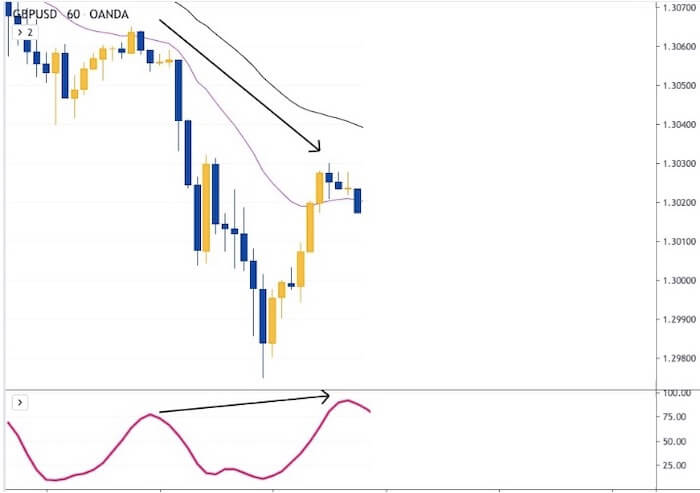
This is a Hidden Bearish Divergence pullback trade in a downtrend.
- From the left-hand side of the chart, the market is in a downtrend. The 20 EMA is below the 50 EMA and the market is trading below the 20 EMA.
- The market then did the first pullback to the 20 EMA, closed above it and then below it again in the next bar. However, the Stochastic Oscillator was not showing a Hidden Bearish Divergence so there’s no trade there.
- The market then did another pullback to the 20 EMA, closed above it and then came back down to close below the 20 EMA, forming a Lower High.
- At the same time, the Stochastic Oscillator was showing a Higher High for a Hidden Bearish Divergence. This was my signal to go Short. Since the close was around 1.3018, I placed a Sell Limit Order at 1.3020.
- Then I placed my Stop Loss above the Lower High at 1.3035 for a 15-pip Stop Loss. I then placed my Take Profit level at 1.2990 for a 30-pip profit which is 2R.
This is how it looked like on the chart:
This was how the trade turned out:
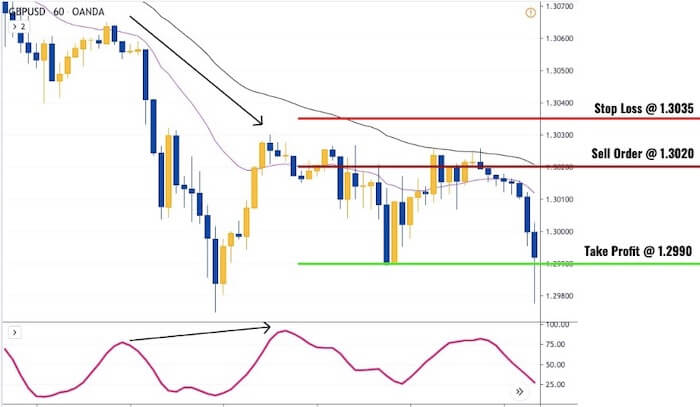
After placing my Sell Limit Order, I got filled two bars later.
As the market got very close to my Take Profit level, I moved my Stop Loss to breakeven at 1.3020.
The market then went down to my Take Profit level at 1.2990.
However, I did not get filled.
Because of the spread, the market missed my Take Profit at 1.2990 and went back up to hit my Stop Loss at my breakeven level of 1.3020.
The market then subsequently went down to hit my Take Profit level.
If I had not moved my Stop Loss to breakeven, I would have taken profit already.
So the question is, should I have moved my Stop Loss to breakeven?
The answer is yes because that is my trading rules.
In this trade, the market, unfortunately, went down to hit my Take Profit level after taking me out at breakeven.
However, the trade could easily have gone the other way as well.
That means it could have continued to go up to hit my Stop Loss.
So if I hadn’t moved my Stop Loss to breakeven, I would have made a loss.
And that would be pretty dumb because I was 0.1 pip away from taking profit, but instead now took a 1R loss.
So hindsight is 20/20.
In this trade, I would have hit my Take Profit if I hadn’t moved to breakeven.
But in many other trades, I might have gotten stopped out if I hadn’t moved to breakeven.
So if it’s in your trading rules, stick to it.
Conclusion
Now that you know what the Hidden Bearish Divergence is and how to trade it…
Go open your charts now and see if you can spot them and trade them.
Start off with either a demo account or a small live trading account trading only 1 Micro Lot (0.01 Lot).
Once you are consistently profitable trading it, then you can start to gradually increase your trading size over time.
Now I’d like to hear from you…
Do you trade the Hidden Bearish Divergence?
Let me know in the comments below.
One more thing…
Did you like this post?
If so, would you please share it?
Remember, sharing is caring, and it won’t even take 5 seconds of your time.
So go ahead, click the share button below now 
Yes! Finally someone wriites about 5emas fodex trading
system.